
TL;DR: For this article, I wanted to write about something that many people are not familiar with, namely the WHY, WHAT, and HOW of migrating services from an on premise datacenter to a public cloud. If you have ever wondered why you should move, what it would cost to do so, or even how to do it step by step then this is the article for you. As a reference, the top half of the article focuses on the WHY and WHAT. The bottom half of the article focuses on the HOW.
As a heads up, this is a long and in depth article. I debated whether to break it up into sections to publish, but in the end I wanted to simplify things by having a single location to reference.
Why would you move to the cloud?
The simple answer is summed up via one word, money, or rather what it represents which is resources and time. This reminds me of a quote that abstractly explains the value and definition as it applies to many organizations.
“A company has no value in and of itself. It only has value to the degree that is effective allocator of resources to create goods and services that are of greater value than the cost of the inputs. This thing we call profit should just mean over time the value of the outputs is worth more than the inputs.”
Elon Musk
Many people assume that the migration to the cloud is more expensive than running the services at their own datacenter. However, much like Dialetheism, this is both a true and false statement. It is true that a traditional lift and shift with the entire existing infrastructure could be more expensive than hosting it in house especially given that many organizations already have their own trained labor force. However, I would argue that also entails additional human resource costs and benefits which are being factored in at another budget line item in the operational budget. Additionally, commodities of scale are a powerful thing to ignore as evidenced by Walmart.
Regardless, the public cloud *CAN* actually be cheaper than hosting the same service as well as being more reliable for the simple reason that building on the public cloud is dynamic and not static. Whereas many IT organizations budget out their spending for the fiscal year, purchase equipment that is designed to accommodate a certain amount of services for a certain amount of time, and then scramble when additional resources are needed suddenly as evidenced by COVID-19.
So what does that mean to be dynamic?
Before I explain that let me give a brief background on myself. I have worked with Google, Microsoft, and Amazon and implemented their tools to perform the assessment and migration calculations for moving our organization to their clouds. After working with the big 3, I am translating this into my own terms that for me are more universal.
The first dynamic principle is scale.
Each service provider will have its own definition of best practices, but in regards to AWS, this would be the AWS Well-Architected Framework which is a guiding series of principles. For scale, this would fall underneath the Operational Excellence pillar. Let’s see how that applies to our COVID-19 example.
In my organization, we were lucky in that we were already running a VDI infrastructure which we used in a limited fashion. However, with the need to offer more virtual machines we quickly had to scale up as fast as we could. Note, I said scale up and not scale out. Scaling out would require ordering additional servers, shipping them, inventorying then, physically installing them, and configuring them for the existing infrastructure. That all takes a lot of time. Scaling up was faster in that you can order additional parts and add them into the existing servers one at a time without a service disruption. In our case, we added additional memory, expanded the VDI datastores, and increased our concurrent VDI licensing.
18 months later what we discovered was that the usage was not sufficient to maximize the service. In fact, the usage was far below what was estimated. A simpler answer would have been to be able to increase VDIs dynamically with incrementally smaller memory, storage, and compute which is what the public cloud offers since you only pay for what you use. If you design your system optimally, it will grow as usage grows rather than the traditional way many organizations run now.
The next dynamic principle is efficiency.
Earlier I said the statement was true, but did not state how it is false. It is false in that the public cloud will always be cheaper if engineered correctly. I know. It sounds crazy and I didn’t believe it was possible too at first, but if you hang with me until we get to the TCO section it will show some surprising math.
Now, let me ask you a question. Right now, I am going to guess you are thinking about a traditional lift and shift strategy and how it is more expensive than running things in house, but have you considered other variables such as service conversions?
If you are not familiar with that, then let me explain the architectural growth of organizations as they mature. Established organizations used to be fully physical with a physical server for a physical service. This worked and led to the rise of the datacenter, but it had some limitations in that the software and hardware were intertwined such that if the hardware went out then so did the software. Additionally, it meant that if other software was on the hardware it could lead to system instability due to incompatibilities or software conflicts.
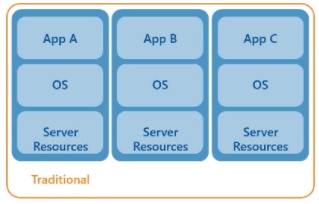
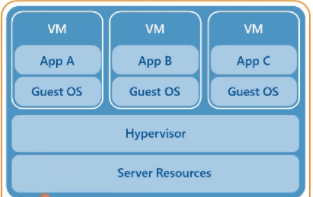
Eventually, this led to the next generation which was virtualization. Virtualization with VMware Server 1.0 arose in 2006 and prior to that was GSX. It allowed organizations to start being more efficient and begin to share their resources and isolate some of their services via sandboxing. This was the beginning of application isolation and also allowed the services to become more reliable since the virtual machines could be migrated while the physical equipment was being worked on.
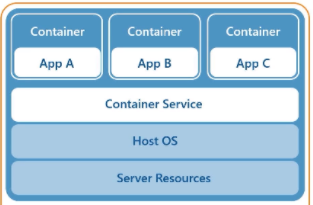
Virtualization eventually led to the next shift, containerization, which became popular with docker in 2013. This further increased the efficiency of services as they no longer had software conflicts or needed to run an entire operating system for each application. Instead, the container could just run the application in its own private sandbox. For the applications that were converted and written to use this platform, this saved space, processing power, and memory which meant less power use and in turn less heat which led to less cooling which led to more power savings which led to further cost savings. Plus, there is the issue of vulnerabilities and patching of multiple operating systems that were reduced too.
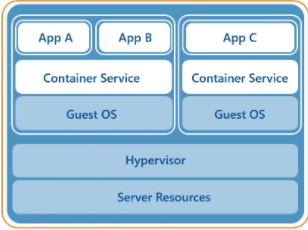
However, one of the great benefits was that you were able to combine virtualization and containerization and get the best of both worlds. Now you could migrate your entire app stack from one host to another.
Now, we move to the current paradigm shift which is serverless computing. Serverless computing is coding your service to either do client side processing in which the endpoint or user has their computer perform some of the computing or alternately sending the processing to another server. In AWS land this is called Lambda. It will accept the process, perform it, and then provide the output. With serverless it is even cheaper than the other options above as you are only paying for the execution of a process rather than needing to rent the entire processor and server itself.
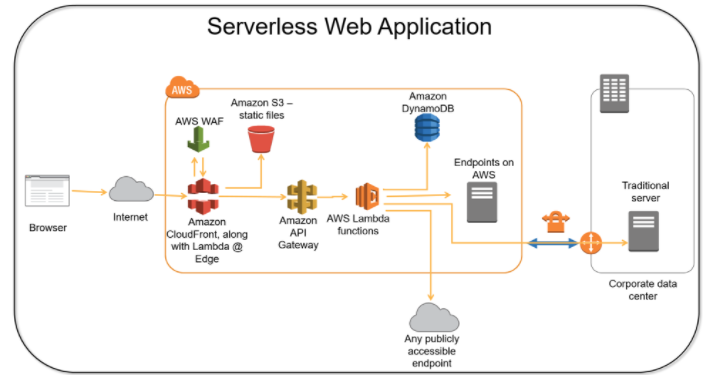
Circling back to the first dynamic principle of scale and combining it with efficiency and you can have some of the biggest gains. Think of a website that has content like images and videos on a bucket of storage ala S3. Any processing needs such as Python scripts are done via Lambda. Netflix uses Lambda to do their encoding. This means that you now just pay for when the operations are run. As load increases during a big surge from users, the infrastructure will dynamically accommodate the added traffic.
This is what a truly successful service conversion looks like. It is challenging to do, but as Stephen Covey said, “begin with the end in mind.”
The third dynamic principle is reliability.
Let’s face it, many of us don’t put backups very high on the list of services we offer or budget in that much. It isn’t sexy or needed often and so we tend to take it for granted both at home and at work. Nevertheless, when things go south, having the option to restore is important.
What if we decreased those chances of failure further? Many organizations only have a single datacenter. If that location has an issue then services are down and no business is being done until that is corrected. Think it won’t happen? Having a single datacenter means having a single point of failure. Look at what happened at the datacenter in France, the winter storm in Texas, and increased threats from Hurricanes or other natural disasters such as earthquakes or wildfires. There is an old adage for storage regarding copies of data and the possibility of data loss that goes where there is 2 there is 1 and where there is 1 there is none.
Another beautiful thing about the public cloud is that you don’t have to worry as much about business continuity. Why? Because each of the cloud providers have multiple datacenters that are interconnected, redundant, and automatically replicated. Their locations are chosen carefully for their safety from natural disasters, power disruptions, or other issues that could occur. In the event that something does transpire, the datacenter data and services are already replicated at another datacenter nearby. In effect, your service is highly reliable and to quantify that value let’s look at the following chart. In the case of AWS, they list their EC2 reliability as four 9s.
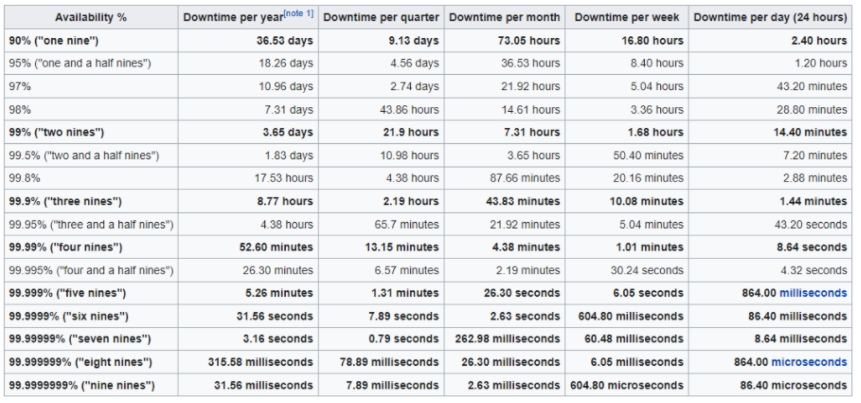
Four 9s means an outage of less than one hour every year. If you are concerned and want to further decrease that number, you can always replicate to more datacenters in other availability zones or regions or even become a multi-cloud and replicate your service to other cloud providers such as Google, Oracle, or Microsoft. For a demonstration of that, please see my multi-cloud article, IT – Multi-Cloud Services, Part 1 – Analyze And Build VMs In 2 Different Clouds, Setup A Domain, Install DNS, And Configure Replication (For Free).
So why AWS? Why not Google, Oracle, or Microsoft? There are a few reasons for that. The first is based on the Gartner Magic Quadrant. It lists the top players based on their completeness and ability to execute. Year after year, AWS is the defacto leader. This rise to the top was primarily driven thanks to Netflix who is their biggest user and forced them to evolve with the growing demands of streaming.

However, the real reason I used AWS is more arbitrary as I simply had to choose between the public clouds for the first of several planned articles. In upcoming articles, my goal is to demystify each of the cloud providers using their costs and tools to help you make a more informed decision based on my experience and knowledge of the different providers.
The fourth dynamic principle is creativity.
Creativity is defined as the use of imagination or original ideals. We tend to only think of it in terms of art, but one of the core needs of creativity is the freedom to explore. Having a single physical datacenter limits that freedom and puts a boundary on the limits of what is possible. It frames things and puts them in a perspective that limits the possibilities of what can be. Imagine not being able to scale out anymore because your physical space is tapped out due to networking, power, or rack capacity. That puts a limit on new projects and causes stagnation to flourish.
That same inflexibility by having a single datacenter also removes the agility that is required to do brilliant things. Imagine being able to have legs in multiple different clouds and experimenting with the possibilities between them. Want to see how fast a resource such as a VM can be spun up or moved between multiple clouds? You can do that. Want to benchmark or test out using one function to work with another provider? You can do that too. Want to completely migrate your entire infrastructure from one provider to another due to a more competitive cost? Go for it. You simply can not do that by having a singe physical datacenter.
Ok, so we have talked about the why. Now let’s take a look at the what and how.
What does it cost to migrate?
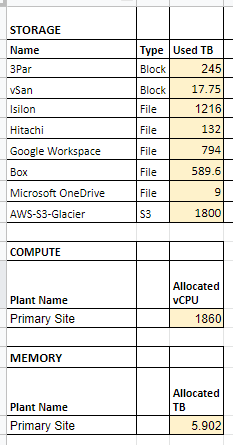
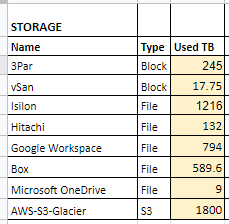
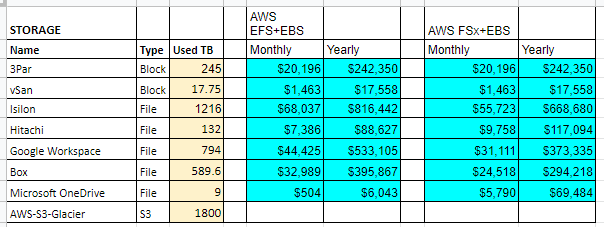
Let’s break down the what or more specifically what does it cost to migrate to the cloud? To answer that we need to first assess our current infrastructure and services and see what that would look like. Here is a sample I created based on a virtualized infrastructure having multiple storage solutions that were grown organically over time. The chart is broken up into columns to define the storage solution, the type of storage (whether it is block, file, or s3 backups), and the amount of storage used rather than total capacity. This is important since we only want to size our cloud environment to our actual usage as it can grow dynamically once in the cloud.
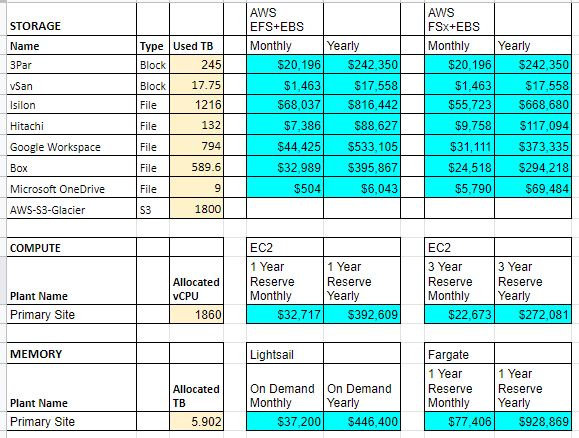
In a traditional lift and shift strategy we would take these values and simply calculate the cost based on storage or compute needs. Here is what that looks like. The columns in blue are the solution to replace it. For storage, the recommended options from AWS are EFS which is an Elastic File System built on Linux or FSx which is the equivalent built on Windows. EC2 is the compute equivalent for virtualization based on Xen. Lightsail is an AWS managed service that offers virtual private servers while Fargate is for hosting containers.
To do the calculations we need to make some assumptions. First, let’s assume your organization lifecycles its on premise servers every 5 years. Those servers support your infrastructure and services that are running both Linux and Windows. To maintain compliance, when we purchase servers we will get a vSphere license with it, but we will reuse our existing vCenter license and Windows Server licenses. When we install ESXi on the servers we will perform it on a flash memory card reader with RAID1 and won’t purchase any internal drives since we will be using Fibre Channel for our block storage.
However, we need to decide on what size sticks of memory to use as this will determine how many servers are required. Do we go with 32 GB or 64 GB and how many? To answer that let’s work backward from our total allocated memory. If we go with a standard 2U chassis from Dell ala a R750 then we can hold up to 24 DIMMs. With 32 GB sticks that would be 768 GB of memory per server. That would mean that based on our current vCenter reporting 5,902 GB of currently allocated memory, we would need ~8 servers. However, to factor in high availability for vCenter we need to factor in failover nodes which in my experience should be run at a configuration of N+2 or better. That means we need 2 more servers for a total of 10 servers.
Hmm. 10 servers is a lot. That’s going to use up 20U of space or about half of a full size rack. That means a lot of rack space, cables, network and fibre ports on our switches, electricity consumption, cooling requirements, and other related costs. What if we went with 64 GB sticks of memory instead? That would be 1,536 GB of memory per server. Working backwards from our total of 5,902 GB of memory then that means we would need ~4 servers. Factoring in N+2 for high availability and that means we would need 6 servers. That sounds better, but we still need to see what the math says for costs.
Going to Dell’s website let’s build out a sufficient Dell R750 which is a modern 15th generation server. Here is a side by side comparison I did of the same Dell R750 server, but with 32 GB memory sticks vs 64 GB memory sticks. Maxing out the server with 32 GB memory sticks for 768 GB of memory is $40,405.05 per server compared to using 64 GB memory sticks at a cost of $61,764.18.
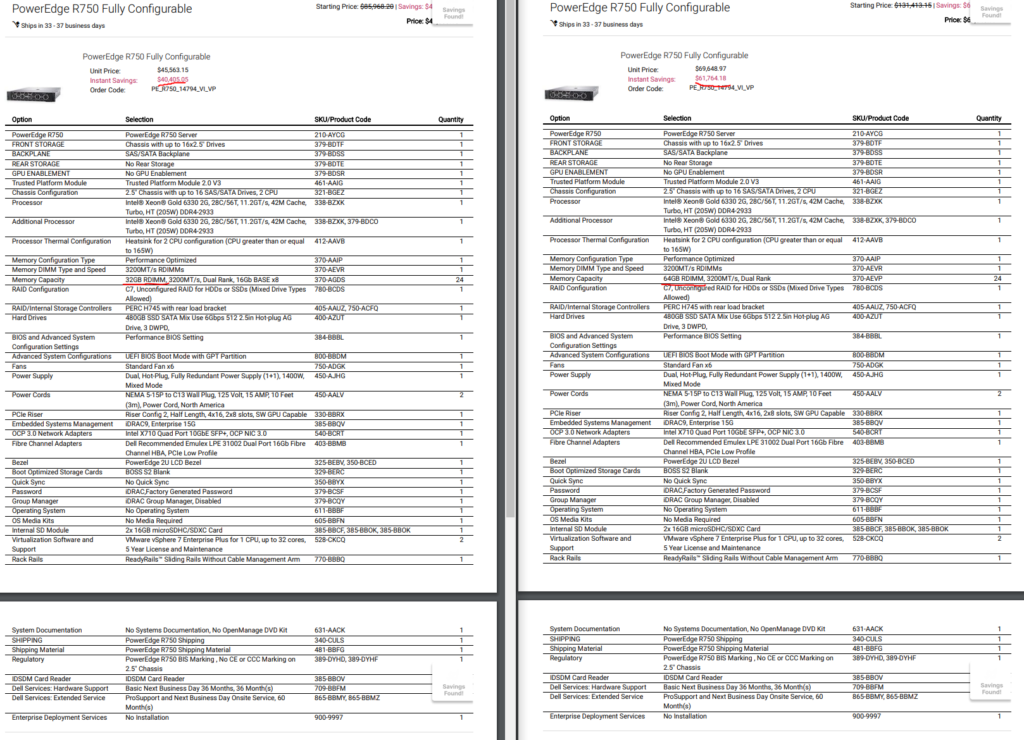
So which is the better deal? If we decide to max out the servers with 24 sticks of 32 GB memory then that will run us $40,405.05 per node. With 10 nodes required that would equate to $404,050.50. Life cycling 1/5 of the servers every year would be 2 servers at $80,810.30 per year.
Alternatively, if we decide to go with 24 sticks of 64 GB memory then that is $61,764.18 per server. With 6 servers that comes to $370.585.08. Life cycling 1/5 of the servers every year would technically be 2 servers per year, but we will pretend to be a conservative organization that decided on 1 and even out the data some. That means we need to budget 1 server at $61,764.18 per year.
Translating this into business and accounting terms, this means that if we decide to use the bigger and beefier servers we would actually save almost $35,000 over 5 years compared to having more, but smaller servers. That also means we will save on our rack space, switch ports, power needs, and heating and cooling costs.
What about storage?
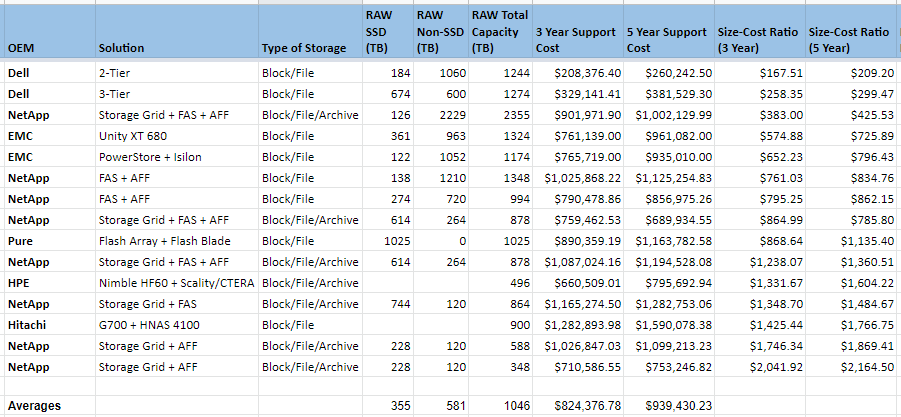
This is tough. Each organization will purchase its storage solutions differently. Some will go with internal drives in servers while others will go with a SAN fabric. Some use SSDs and some do not. That said, here is a sample comparison of different anonymized vendors providing storage solutions to meet different needs between block, file, and archive. The costs vary from the cheapest being about $260k to the most expensive being $1.6M. If we average out the values, we get a 3 year cost of ownership that is about $824k. It has 355 TB of SSD space and 581 TB of spinning disks.
Based on our sample usage, we are using about 263 TB of block storage and 1,348 TB of file storage. Additionally, we are already using cloud storage for Box, Google, and Microsoft that accounts for an additional 1,393 TB of space. Finally, our backups that are going to S3 Glacier now are 1,800 TB in size. Our storage replacement solution sample quote is expensive and will only be able to fully accommodate our block storage that powers our Virtual Machines and a portion of file storage.
However, let’s see if we can compare some of those solutions to AWS and their offerings. Here is how this translates into AWS based on our different options – EBS (block), EFS (file), FSx (file), and S3 (object).
What does block storage cost?
To provide storage for our Virtual Machines on our EC2 servers means we will need to use block storage and that means EBS. EBS has a flat fee for storage based on either size or IOPS. We will go with size because as the size of the volumes increase, so do the IOPS.
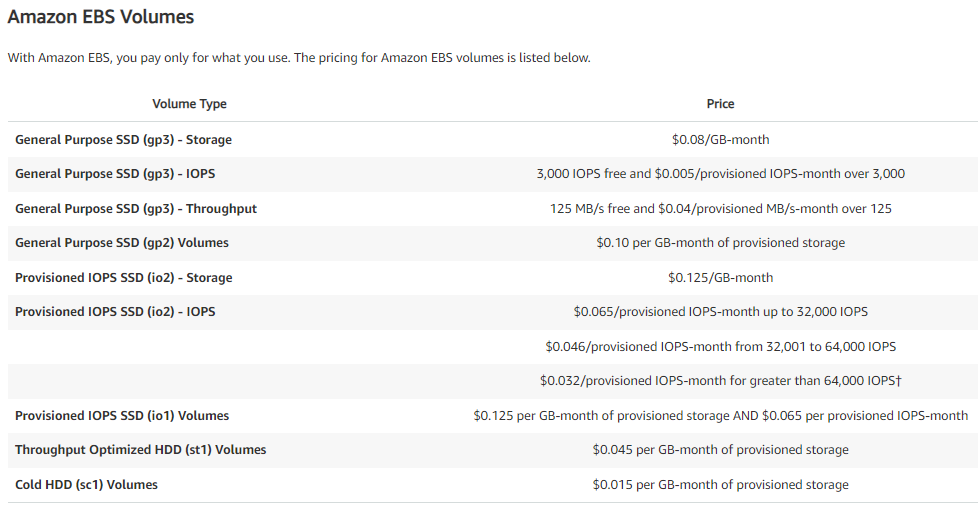
Our block needs are 263 TB total. If we standardize and give all VMs SSDs, then the customers and system administrators will be happy, but decision makers might not be due to cost. Or will they? The math says it is 8 cents per GB per month. For 263 TB, factoring in a 1,024 conversion rate, that is $21,544.96 per month or $258,539.52 per year. Not great, not terrible. If we went to conventional spinning disks that are optimized for throughput that would drop down to less than 5 cents per GB per month to $12,119.04 per month or $145,428.48 per year. If we went to cold HDDs the cost drastically lowers to less than 2 cents per GB per month to $4,039.68 or $48,476.16 per year. If we did a tiered approach and mixed all three storage options then that averages out to about $150,814.72 per year.
Additionally, we can even add in snapshots so that we can go back in time, say during a ransomware attack, at a cost of 5 cents per GB per month. If we use a 1% snapshot rate that would be $134.66 per month or $1,615.87 per year.
Taking the tiered approach and using a 1% snapshot retention rate gives us an annual spend of $152,430.59.
What about file storage costs?
One of the bigger hurdles to any organization is where to put all of the data that is being used. In our example above, we are using a hybrid approach that is utilizing file storage on premise and on the public cloud. Given our sample storage replacement above, if we subtract the Average RAW SSD space at 355 TB from the Average RAW Total space leaves us 691 TB of non SSD storage. Plus, we have the unused SSD block storage space which when you subtract 263 TB from 355 TB gives us another 92 TB of SSD space. This means our remaining space that we can use for file storage is 783 TB. So what does that get us?
Our options are S3, EFS, and FSx. Each have their own strengths. FSx is great for Samba shares and can handle deduplication. EFS is good at NFS and can do Samba. S3 has an automatic life cycling system for archiving data. Let’s look at each.
S3 arrived in 2006. When AWS first arrived your option was to either setup a server using EBS storage and then create a file share on top. Otherwise, you had S3, but it was designed to provide object storage rather than file storage.
That said, if we wanted to create a 783 TB object store here is what it would cost.
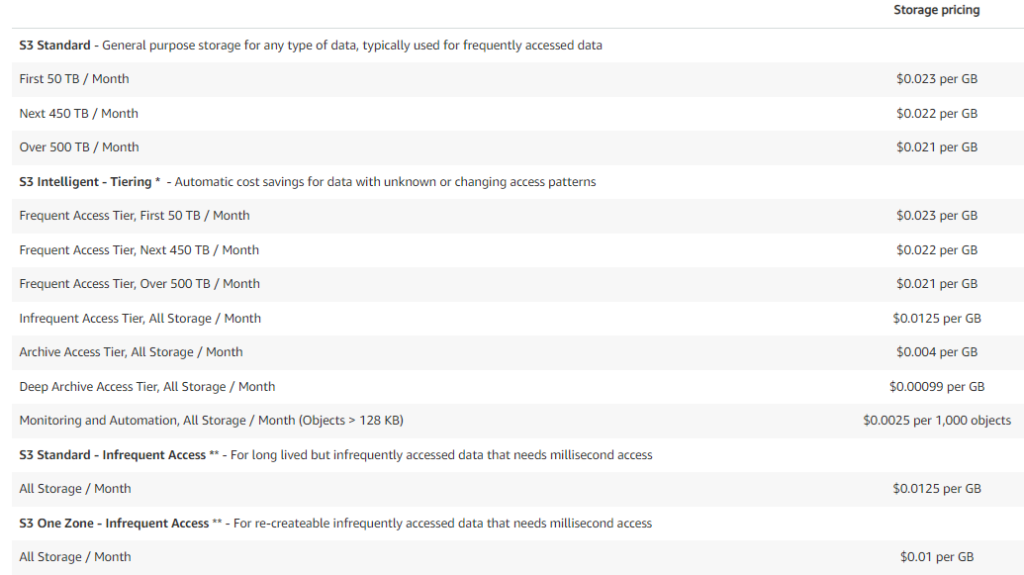
Since we are not positive on how our data is being used or what is accessed more often we will use S3 Intelligent which will automatically lifecycle files into cheaper storage that are not used as often. This is what the first month would cost until the data was moved due to not being accessed.
First 50 TB / month @ .023/GB = $1,177.60
Next 450 TB / month @ .022/GB = $10,137.60
Next 283 TB / month @ .021/GB = $6,085.63
Monthly Total = $17,400.83
AWS EFS cites that typically 20% of data is frequently accessed. Using that value, that would mean that after the second month, the costs would reduce to the following.
First 50 TB / month @ .023/GB = $1,177.60
Next 107 TB / month @ .022/GB = $2,410.50
Infrequent Access 626 TB / month @ .0125/GB = $8,012.80
Monthly Total = $11,600.90 (Decrease 66.6%)
S3 total yearly spend is $145,010.73.
The costs are attractive. Unfortunately, it is not designed to serve files, just objects. This means it will be limited to storing audio, video, and images. There are ways to use it as a file store ala programs such as Raidrive, but it requires software to be installed on the endpoint so that they can communicate to the S3 bucket and get the files. If you are interested in what it looks like using object storage as file storage, please see my article, Crazy Idea – Using Cloud Storage As Local Storage [Initial Testing Included].
What about EFS?
EFS arrived in 2016. It is built on Unix and designed to serve up NFS and SMB traffic. Calculating EFS cost is fairly simple.
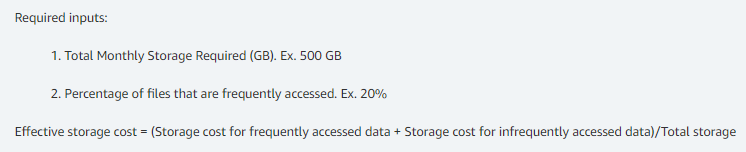
This means with our remaining 783 TB of space at a 20% rate of frequently accessed data would yield the following breakdowns.
783 TB * .2 = 156.6 TB frequently accessed.
783 TB * .8 = 626.4 TB infrequently accessed.
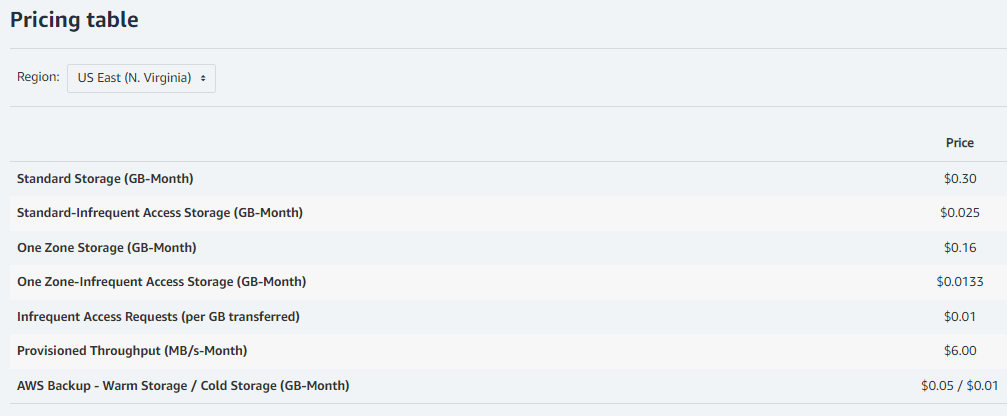
Assuming we use One Zone which are multiple datacenters in an availability zone, then based on the 156.6 TB of frequently accessed data multiplied at 16 cents per GB is $25,559.04 per month or $306,708.48 per year. For the 626.4 TB of infrequently accessed data multiplied at .0133 cents per GB is $8,531.07 per month or $102,372.80 per year.
EFS total yearly spend is $409,081.28.
What about FSx?
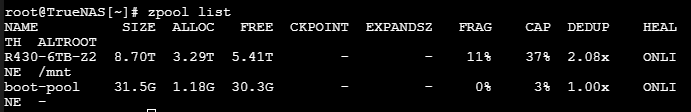
FSx is the newest offering for file storage. It started in 2018 and is built on Windows Server. It serves up SMB and adds in the ability to perform deduplication. That ability alone can save you an enormous amount of money. Consider your own organization and how it has users that share files with one another that are the exact same file. Instead of having enterprise storage eaten by a copy of a copy you can just have one file and link to it. AWS themselves touts an average 50% savings in space. I can believe it as in my own testing I have seen twice the savings on TrueNAS as evidenced by the DEDUP column below. Note, my pool is 6 TB, but the size is showing that with the savings it is technically almost 9 TB.
FSx pricing is straightforward. Just choose type of storage, storage capacity, and throughput.
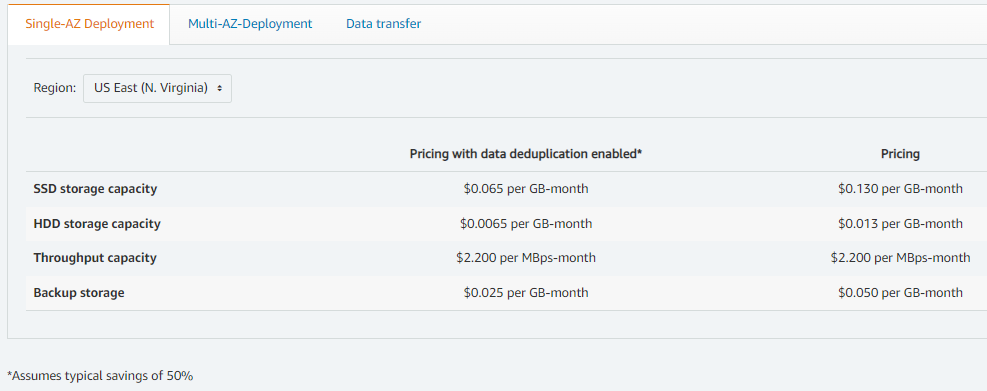
If we choose non SSD storage that is a cost of 783 TB * 1024 bits * .013 $/GB. That translates to a cost of $10,423.30 per month or $125,079.55 per year including deduplication. Curiously, that potentially increases our storage by 50% which gives us 1,566 TB of storage. Alternatively, we could reduce our space while using the dedupe function to save our costs. If we only allocate half our 783 TB, about 392 TB, and use the deduplication function that will theoretically yield us the same 783 TB we originally wanted, but at a cost of $5,218.30 per month or $62,619.65 per year.
If we use FSx, we will need to create several filesystems to maintain the data. Since each filesystem has a max size of about 65 TB we will need six filesystems.
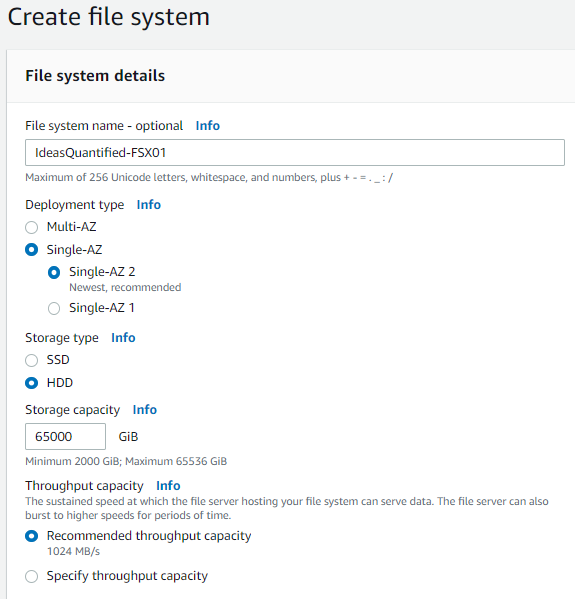
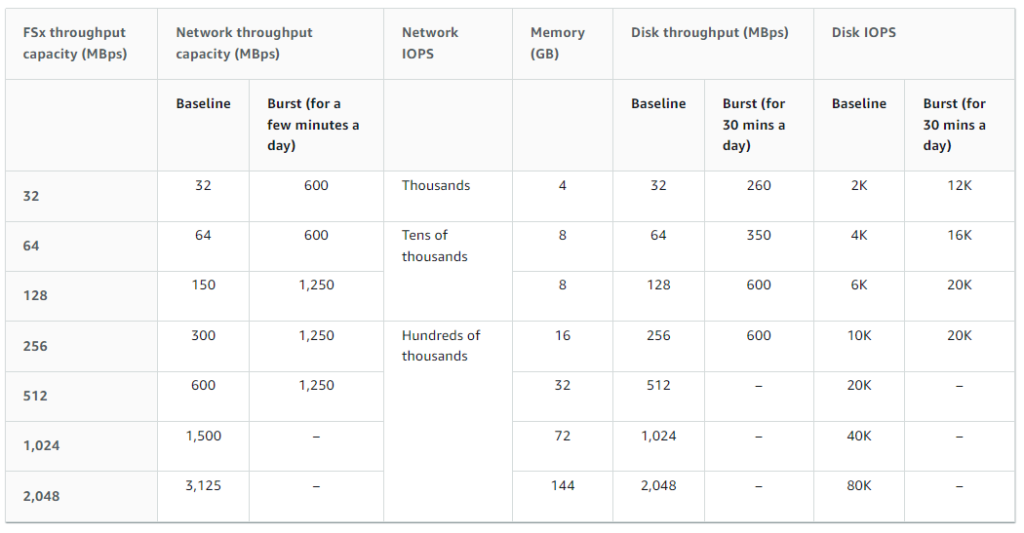
Throughput is determined based on capacity, but can be overridden. In our case, we won’t need to. Since the recommended value was 1024 MB/s, that will be our baseline throughput and means our network traffic will be over a GB/s. This means our cost will be $2.20 per MB/s a month or $2,252.80.
All total our FSx yearly offering would cost:
$62,619.65 for 392 TB of space with deduplication and a theoretical 783 TB of total capacity.
$27,033.60 for 1,024 MBps throughput.
FSx total yearly spend would be $89,653.25 excluding data transfers outside the availability zone. Those transfers are 2 cents per GB or about $20.48 per TB. This makes FSx the winner in the cost battle against EFS.
S3 vs EFS vs FSx Cost Comparison:
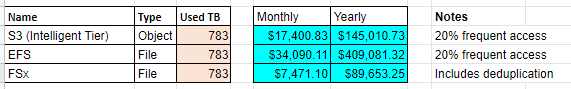
It is important to note that sometimes multiple solutions will be needed as each one offers important functions. For example, FSx appears to be the clear winner for cost, but it does not offer NFS mounts so if that is needed by your organization then you will need to consider using EFS.
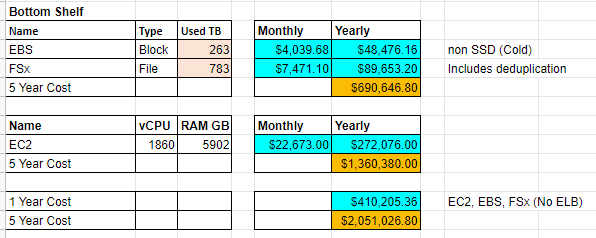
Going back to the chart on our own usage for each storage solution and looking at the costs shows the following if we were to migrate those elements to AWS.
FSx includes deduplication and backups.
Checking our sample usage we can see a utilization of 263 TB of block storage and 1,348 TB of file storage. Based on the above cost models, the recommended options are the following:

What about power costs?
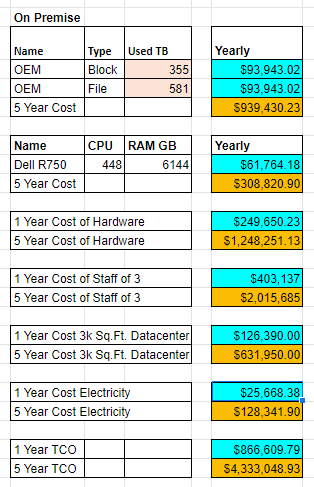
Continuing off of our example of having 6 Dell R750 servers run on premise that are using dual 1,400 Watt power supplies equates to a possible 2,800 Watts per server. With 6 servers that is a possible 16,800 Watts (16.8 kw) of total power used per hour. If we then multiply that by the average cost of power in the United States which is 12.52 cents per kilowatt hour then that is a theoretical daily cost for those 6 servers at $50.48 per day. From an operations perspective, we would need to make sure to budget in a worst case scenario of $18,425.43 of power costs for the year excluding the added strain of what the servers would cost for the HVAC system.
Note, I have not added in the power utilization for the storage solutions as it depends on the vendor, but you can estimate that it will be a rackmount server with dual redundant power supplies as well as attached storage with their own redundant power supplies. As a point of reference, a Dell Compellent is made up of an SC4020 controller that has dual 580W power supplies and SC220 expansion bays that use dual 700W power supplies. Depending on the size and number of expansion trays and that would be 6,660W of power (6.6 kw) per hour at max usage for a controller with four expansion trays. Based on a power cost of 12.52 cents per killowatt hour then that is a theoretical cost of $19.83 per day or $7.237.95 yearly.
The servers plus storage power consumption theoretical max cost would be $25,663.38 per year excluding networking, HVAC, and other elements.
What about real estate?
Real estate is another area for added savings. Average cost per square foot for 2020 in most markets is approximately $42.13. Considering the average full size 42U rack is approximately 4 feet deep and 2 feet wide then that means 8 sq. ft. of space is required for that rack at an average cost of $337.04 per year. It sounds cheap, but remember this is only for 6 servers in a single rack. We have not factored in all of the other associated equipment such as racks for storage or switches nor have we factored in space for generators, generator fuel tanks, HVAC systems, office space, bathrooms, conference rooms, etc. That will add up.
In fact, if you were to completely migrate and decommission your datacenter, considering the average datacenter is about 100,000 sq. ft., then that would be a projected cost in the millions. Even in one of the cheapest markets such as Texas that would be a projected cost of $3,034,000 per year.
What about other costs?
Of course… in a lift and shift strategy where all infrastructure and services are migrated, there is a substantial amount of money being spent especially given that parallel infrastructures for both on premise and public cloud are running concurrently during the transition. AWS does provide incentives where they buyback old equipment, but even factoring in discounts that is still a no contest win for on premise infrastructure… But maybe if organizations consider what their own datacenters cost from a personnel, real estate, and utility standpoint they could see how the math begins to change.
In a lift and shift strategy you are migrating the majority of your services which means the datacenter will most likely be decommissioned and at which time the personnel will be transitioned into another area or let go of entirely. So what does that cost? Glassdoor rates the average salary for a datacenter technician at $54,273. Benefits typically account for another 50% of costs between health, dental, vision, retirement, etc. All in, that means the organization is paying $81,409.50 with benefits for a single full time employee. Most datacenters tend to have multiple shifts so if you consider three shifts for a 24 hour period during a 5 day work week, exclude weekends, and that would be $244,228.50 in salary savings. Adding in a dedicated manager at $105,939 or $158,908.50 with benefits and that is $403,137 for a manager with a staff of three including benefits per year.
So from an operational standpoint, at the conclusion of an on premise datacenter decommission, the account books show that we are no longer spending an annual cost of $61,764.18 in servers, $25,668.38 in electricity, plus $403,137 in personnel. This is not even factoring real estate and other related charges to other infrastructure. That is $490,564.56 per year. Let’s look at the graphic again and focus on the servers.
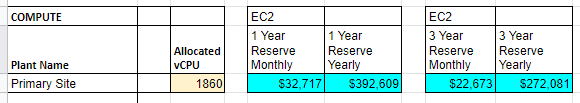
If we go with a 3 year reserve that means we are paying $272,081 per year for servers that have four 9s of reliability, are replicated to other datacenters, and staffed equivalent to our existing servers. This also means not having to worry about other fees and costs including electricity, heating and cooling, plumbing, generator maintenance, real estate, etc. This is the point at which even a lift and shift begins to provide bigger cost savings.
What if you want to keep your existing datacenter and personnel and become a hybrid cloud? Great question. The problem is that it is somewhat expensive and complex. It is like the argument of a hybrid versus an all electric automobile. Many people think hybrid and they think it has the best of both worlds, but it also means added complexity and cost. In the end, it will never be as effective as if it focused on either gas or electric due to the additional parts required. For example, an ICE is fairly complex with thousands of parts. It needs an engine and fuel sure, but it also needs a gas tank, fuel filters, air filters, radiators, transmission, catalytic converter, and a ton of other parts to make it all work. An electric vehicle is similar to a forklift or a golf cart in that it needs only a motor, battery, and controller. Now combine those two things together.
That said, there are definitely circumstances, including data assurance or compliance, where it is important for keeping data or control of services on premise.
Total Cost of Ownership:
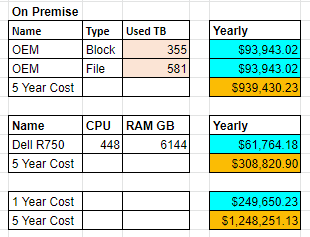
Whew. We finally made it to the end of the cost projections. So that is a heck of a lot of information so let me try to simplify and circle back around. In the beginning of our storage section we were comparing the OEM vendor proposals for storage solutions. After aggregating the information, we arrived at an average amount of 355 TB for SSD and 581 TB for non SSD storage. The 5 year average cost was $939,430.23.
When we looked at the servers, the average cost of a single server that was being life cycled every year was $61,764.18 with a 5 year cost of $308,820.90.
All total the on premise TCO was the following for the servers and storage.
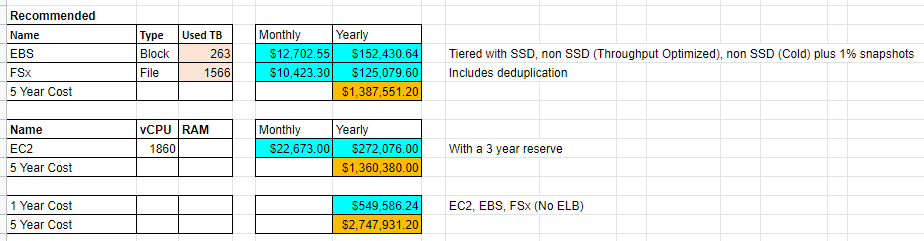
Based on the needs, in the event of a lift and shift, I see two possible choices. Option 1 is a tiered approach that has SSD and non SSD storage and has sufficient storage capacity to replace multiple storage solutions at once.
Alternatively, as a comparison, here is the least expensive or bottom of the barrel option.
Analyzing the difference between the on premise and recommended and we can see the following changes.
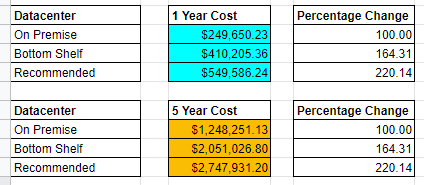
It looks like a true win for on premise infrastructure. However, let’s dive deeper into the other values including electricity, personnel, and real estate and then make another judgement.
Remember that those values and how I arrived at each of them are above in the other related sections. For personnel it was based on Glassdoor averages. For real estate, I used a Silicon Valley scenario with a Gilfoyle and crew running a datacenter out of a 3,000 sq ft house. For electricity, I only used the estimated cost of what the electricity would be for the servers and storage. The values do not include additional power for things such as networking or desktops used by datacenter personnel.
Let’s see how those new values compare again for the on premise TCO against AWS.
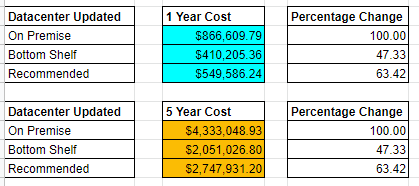
I know. It’s shocking. I asked you earlier to hang with me. If you did, thank you for your patience.
What the math tells us is that if we were to migrate to AWS there is the potential to optimize our operational spend while also increasing our resiliency. Please keep in mind these projections are only for a lift and shift cost analysis. We have not even gotten to containers or serverless architecture yet.
Hopefully by now you can see that the argument is not quite as binary as it first seemed. It is worth noting that these cost figures are not optimized as they undoubtedly have incorrectly sized Virtual Machines that have too much memory, processing, or storage allocated to them. If you check your monitoring on your infrastructure I can guarantee you that some of your own Virtual Machines were probably sized for a utilization that does not occur and were just created because of a standardized approach, a ticket that requested a certain size, or a vendor recommending their own best practices.
Keep in mind, we have not even gotten to containers or serverless computing. This is just what the possibility would be for an unoptimized lift and shift.
What about containers?
This is where it gets tricky. For containers, AWS will charge you based on the following criteria.
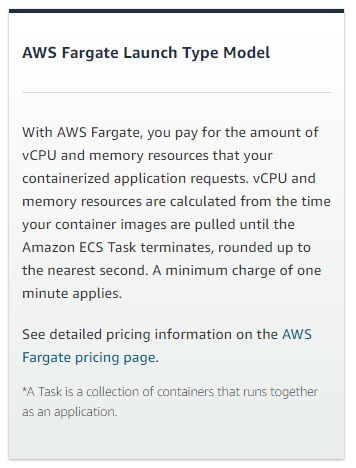
That means it is important to design your containers to run only when needed. This is our first step toward working to become more efficient and eventually transition to a completely serverless architecture.
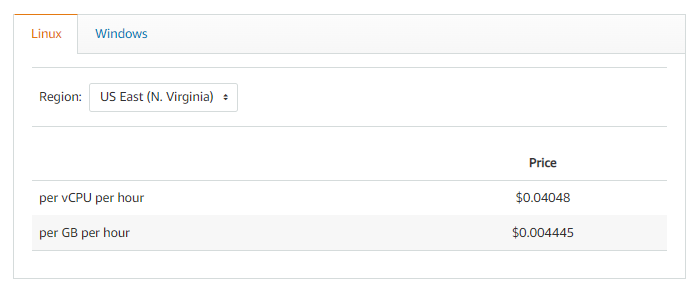
Fargate has the following pricing.
Here is where scaling out becomes critical. To be truly successful you need to have accurate data about the usage of the service and/or design a system that can scale appropriately. That can be accomplished in several ways with a load balancer monitoring the usage of a service and then adding additional nodes as needed and cyling the load between each of the nodes. That is hard to represent, but let’s see if we can model a containerized WordPress site that has a relatively low load except during certain times such as Black Friday or Cyber Monday. To model that we will start with a baseline of a single processor and 4 GB of memory. During shopping times such as the weekend of Black Friday and Cyber Monday the load increases by a factor of 10. What does that look like?
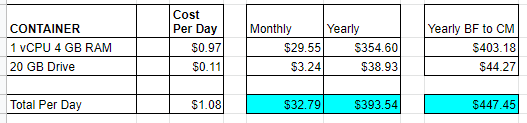
This shows us that scaling up by a factor of 10 for five days (Black Friday thru Cyber Monday) increases our costs by only 14% given that $447.45 is 113.70% of $393.54. This means a way better ROI by spinning up additional resources for five days compared to running nonstop all year. As a comparison, if you let your services ride all year with 10 containers that would be $3,935.39 versus $447.45.
What about serverless?
This is the cutting edge and the pinnacle of where cloud computing is currently at from a cost and efficiency perspective. AWS serverless architecture is dependent on Lambda to purchase time slices of processing power. You can purchase processer cycles for x64 or Arm architecture as well as allocate memory to the process. As an example, let’s take a look at the following.
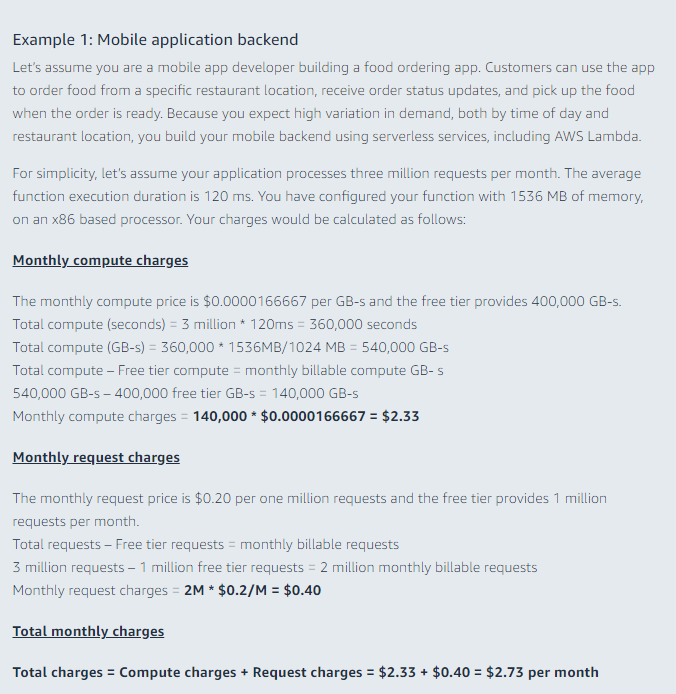
Yes, those figures are per month. It will definitely be cheaper than renting an entire server to host an application to perform serverside processing, but be wary of unoptimized code. One of the principles that AWS touts is evolution in the Operational Excellence pillar of the AWS Well-Architected Framework. That means iterative and ever improving tweaks to code and services. Otherwise the old programming adage will apply of “garbage in, garbage out.”
How do we migrate?
Cool. It sounds interesting and I would like to try out migrating a non critical service to test. How do I do it?
Buckle up. Grab some coffee. Get ready. This will be a long one.
In AWS, they want you to use the Migration Evaluator. It will analyze your servers to see the utilization. It is fairly simple and can tie directly into vCenter to read the vCenter database for metric related information. This will allow AWS to make recommendations to resize VMs to a proper sized AWS instance type such as a t4g.medium.
Here is their sample for servers and databases. Note, there are additional options for data including the AWS Snow Family.
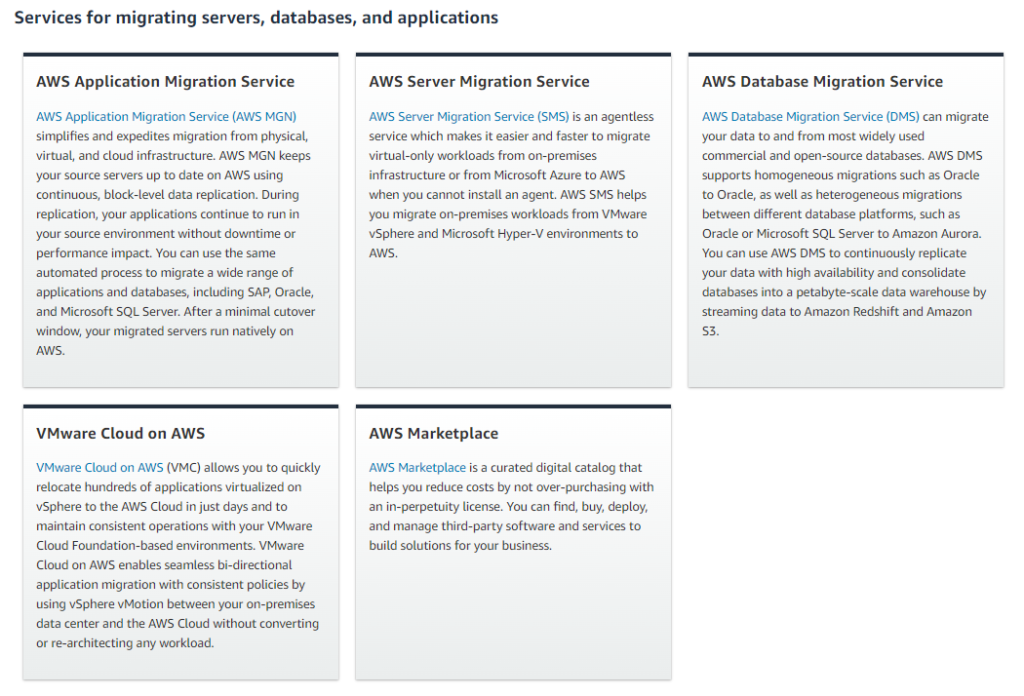
Once you are ready to migrate you have several options. For this demonstration I will be using the AWS Server Migration Connector which is an OVA that deploys inside vCenter. It will deploy a lightweight VM that will perform all of its operations agentlessly by creating snapshots of VMs that it will copy to AWS and build replicas off of.
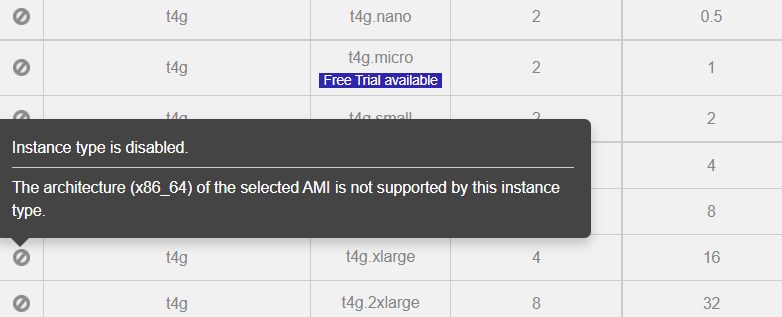
It is also worth noting that the VM import/export process does not work with every operating system out there. For example, during my migration testing I wanted to move an Ubuntu 21.10 VM from my vCenter to AWS. However, the console reported it was unsupported.
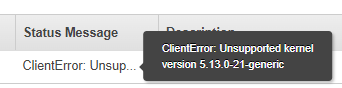
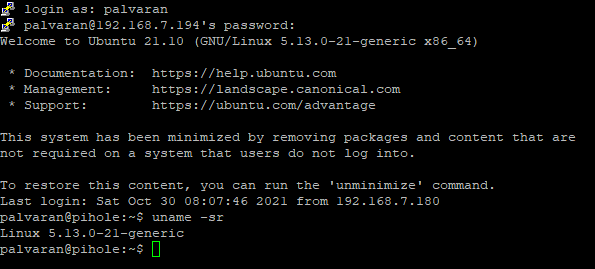
Cross referencing and there is no supported AMI for that kernel.
Another thing worth mentioning is that this particular tool does not work without vCenter so be advised. That said, if you only have vSphere you can do a VM Import/Export.
Also, bear in mind that your security is only as strong as the weakest link meaning that you should build your AWS VPC with best practices using a WAF, disallow internet access to all services that do not need them, use a NAT for those that do, use secure passwords, etc.
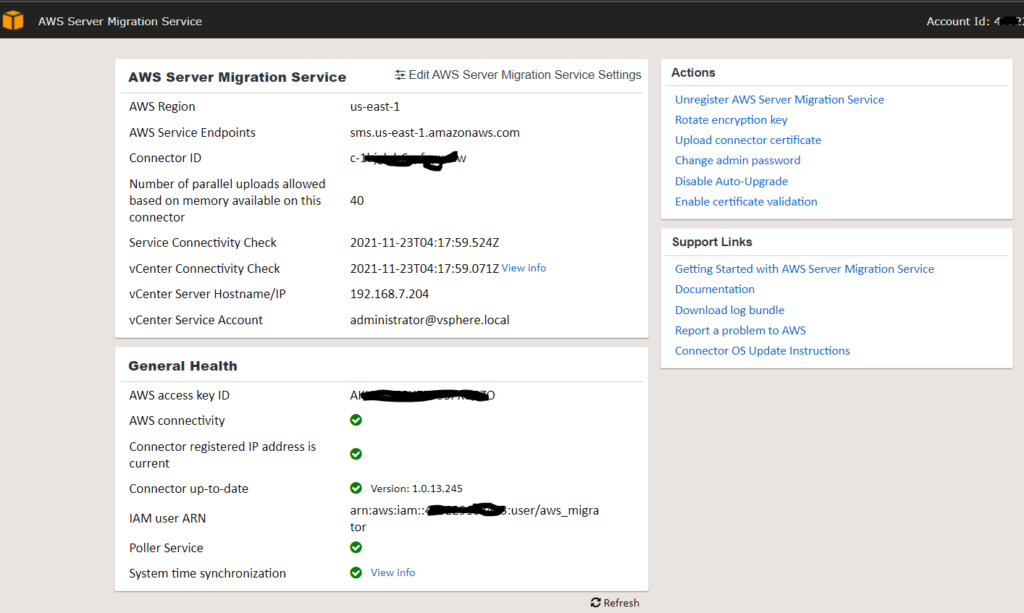
Once you have it installed, you can see it is running.
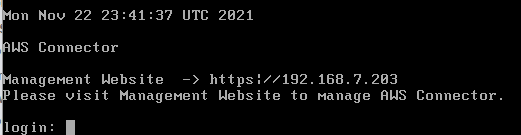
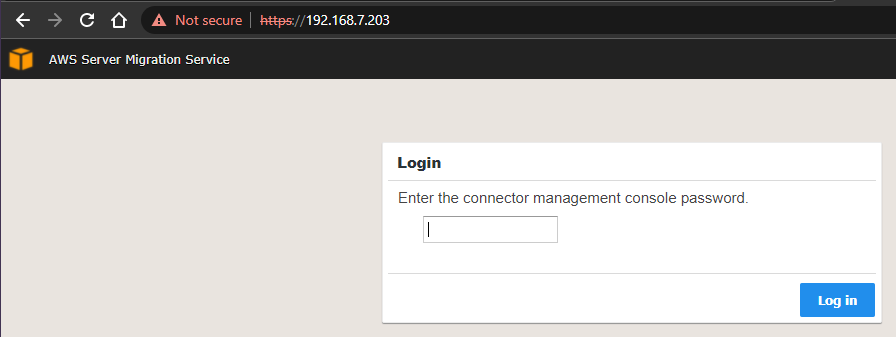
Next, login to the url that the appliance gave you.
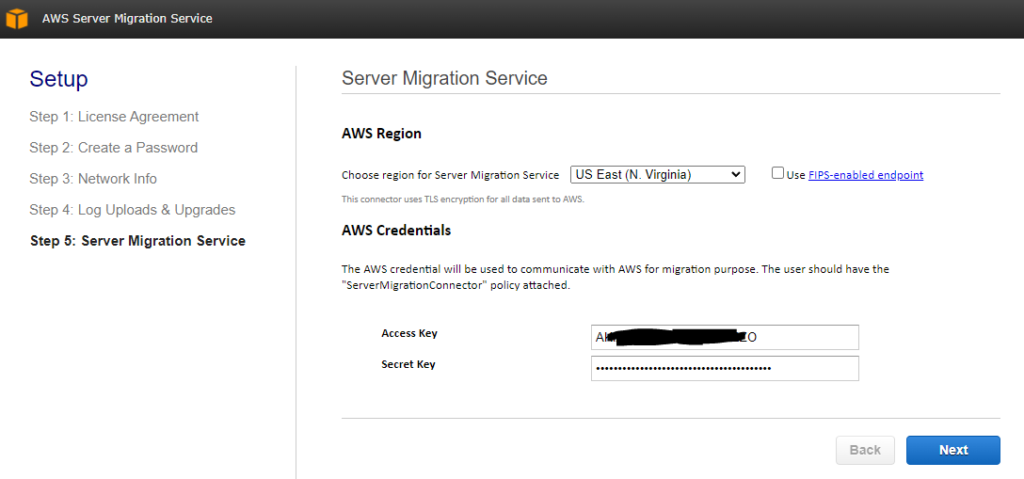
Go ahead and step through the first steps. It will ask you to create a password to login to the VM as well as network related information. For the Access Key and Secret Key you will need to create an AWS programmatic account that has access to your AWS infrastructure. Those keys will be how it performs certain operations.
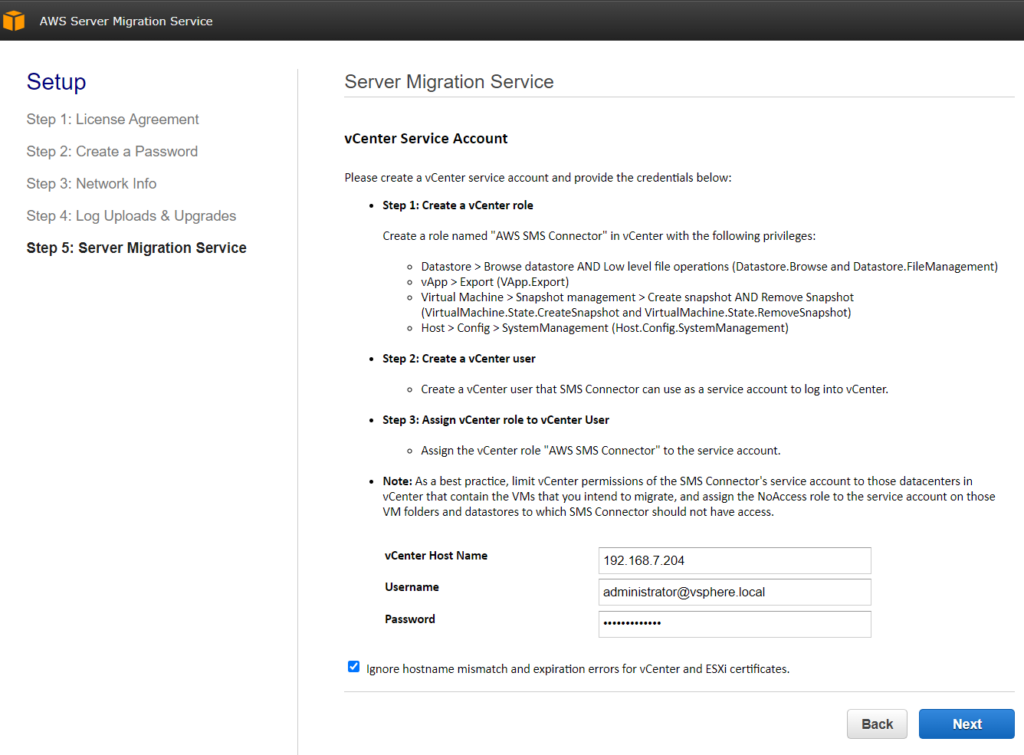
Now you can enter in your vCenter credentials.
Congratulations. You have built your bridge and are ready to cross the Rubicon river and into AWS.
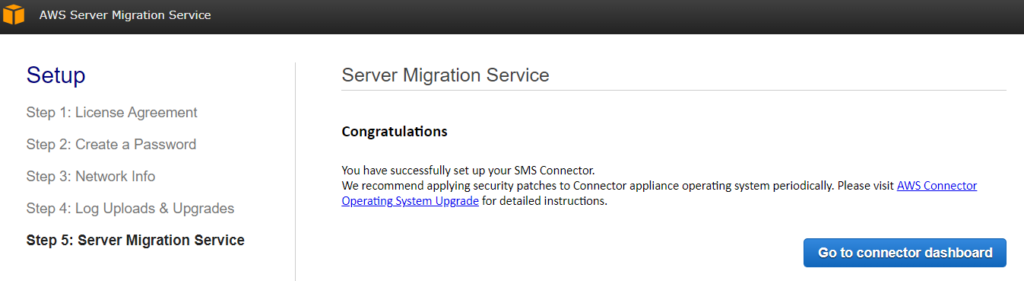
Go ahead and click the connector dashboard. It will prompt you to login to your AWS Console.
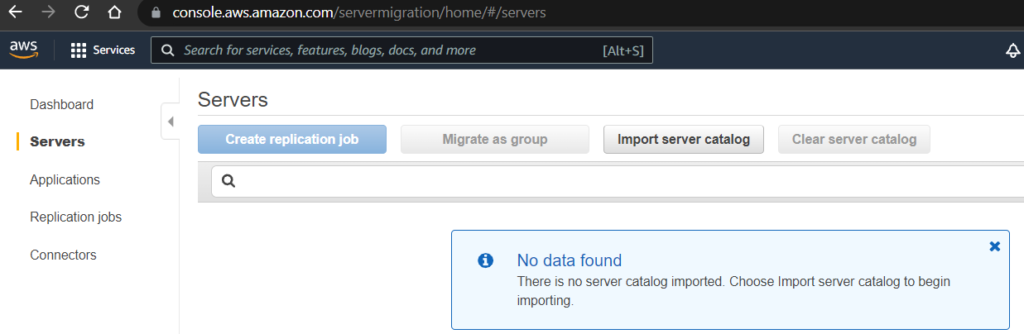
Now, we need to do a discovery on our assets. Click the import server catalog button.
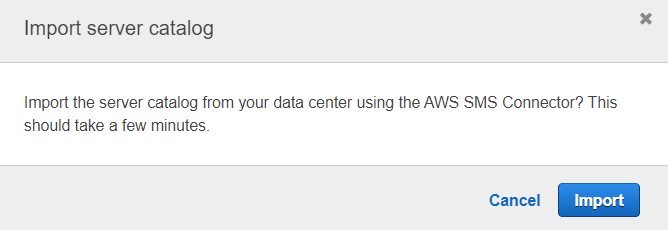
Click import.
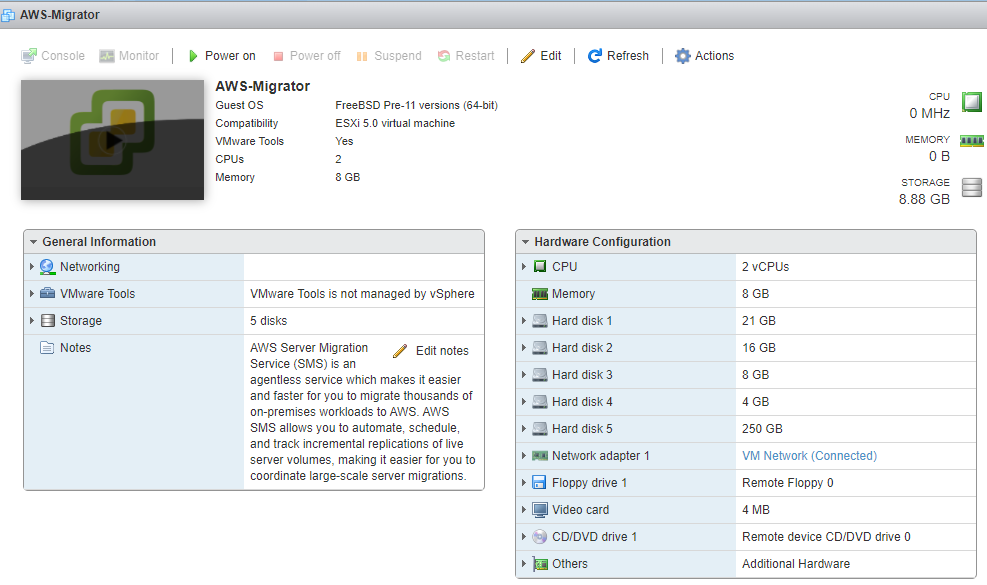
If your permissions are correct, it will detect all of your VMs inside vCenter.
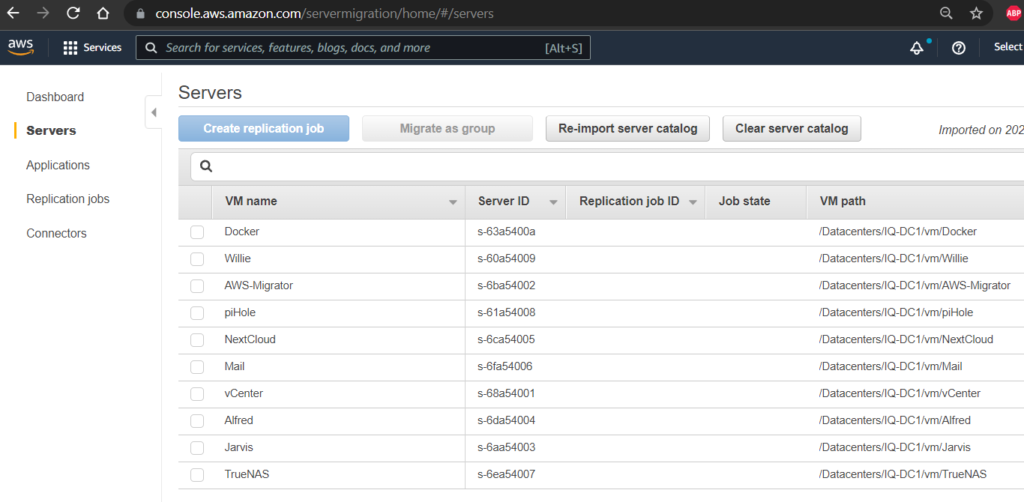
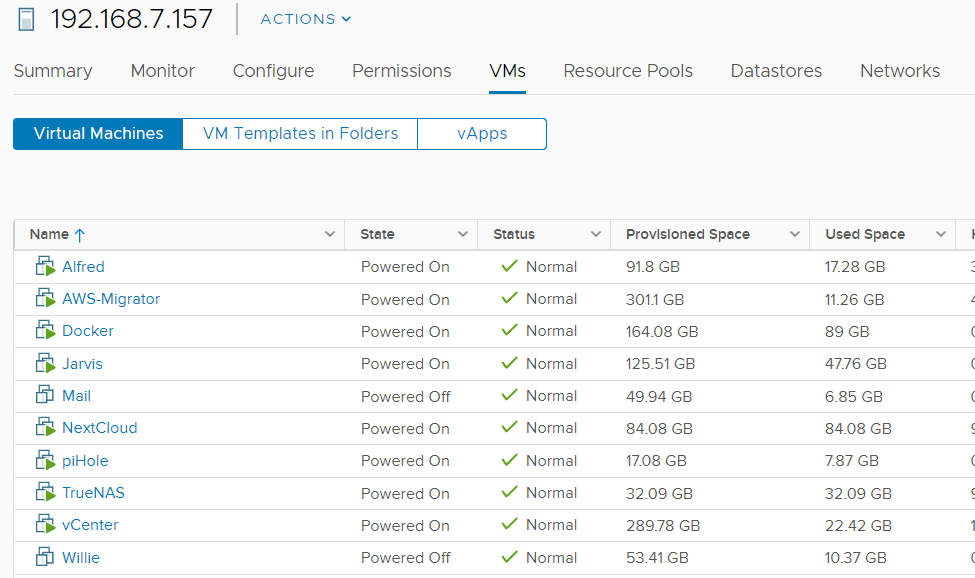
For comparison, here is what vCenter looks like.
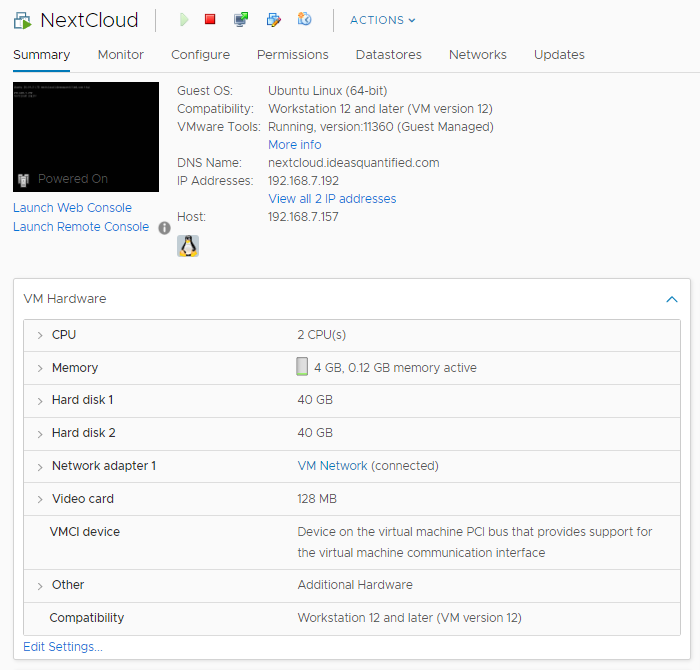
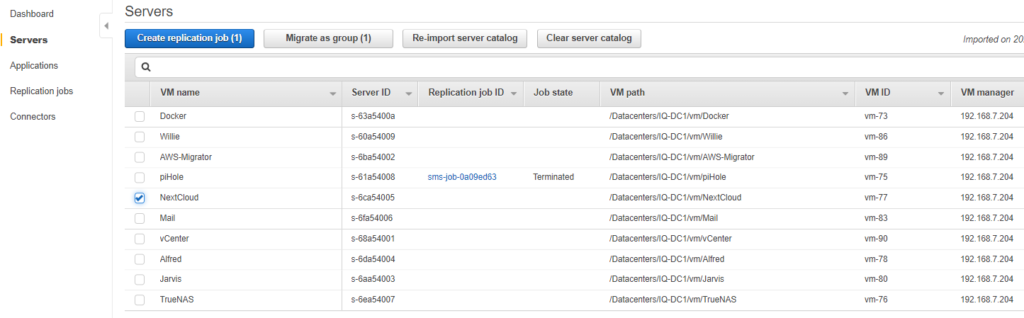
Now let’s choose a candidate to migrate. How about NextCloud? It is fairly lightweight and easy to test.
From inside the AWS Console, just choose the VM to migrate and hit Create replication job. Note, piHole was terminated as it is using an unsupported Kernel (Ubuntu 21.10).
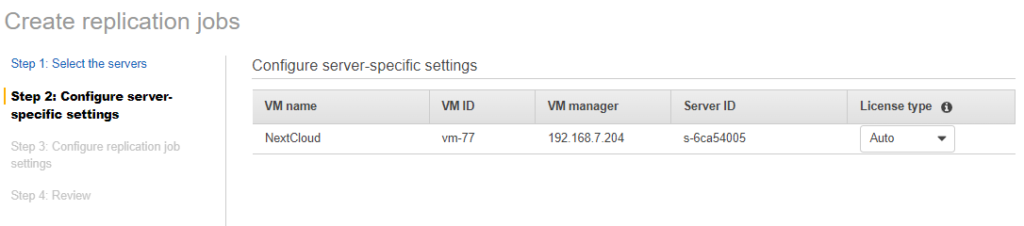
Confirm the settings.
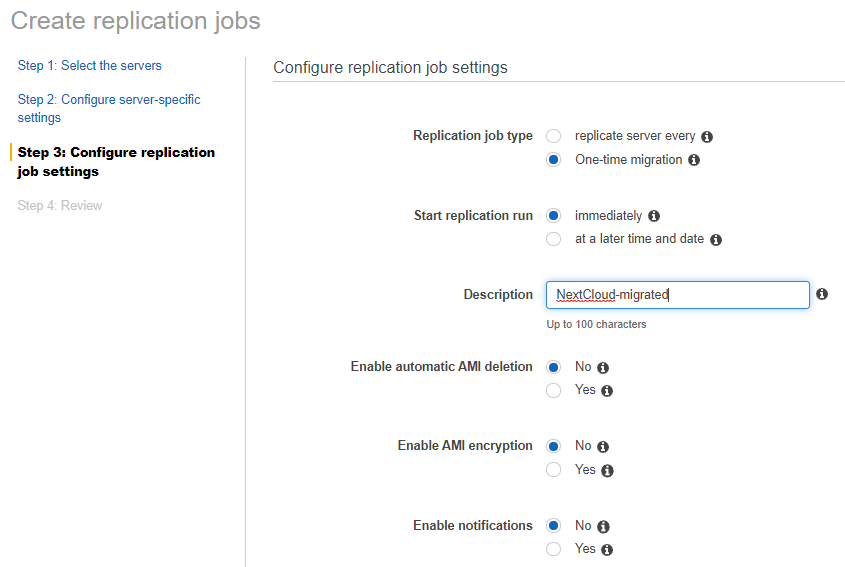
Perform a one time migration and create a role. Don’t worry about encryption for now as ideally you would escrow your keys inside a key vault like AWS KMS.
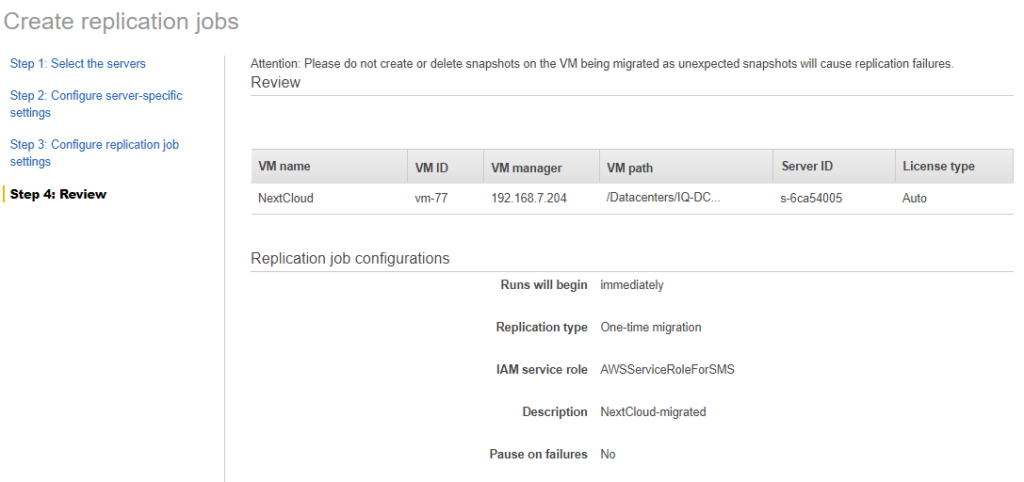
Hit create at the bottom right.
Now just sit back and relax.
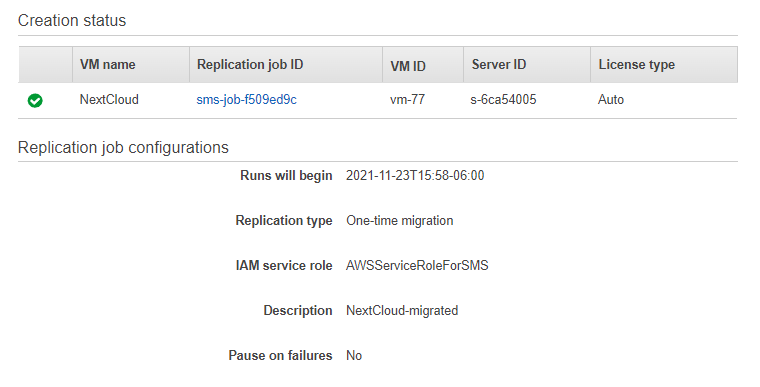
If you check your replication jobs you will see it is now queued.
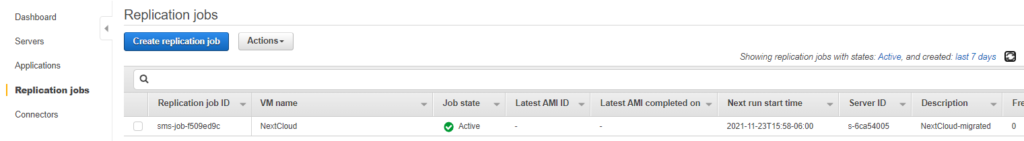
Checking back in vCenter and you should see that the process has begun.

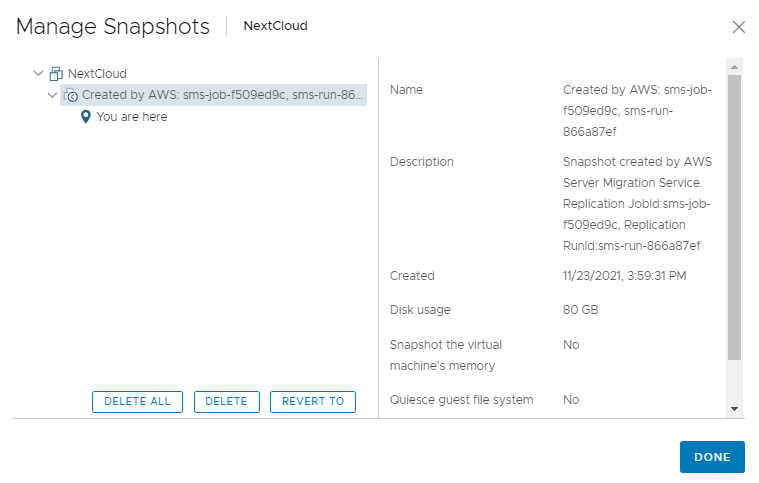
Digging deeper and we can see that the snapshot was recorded with the following information.
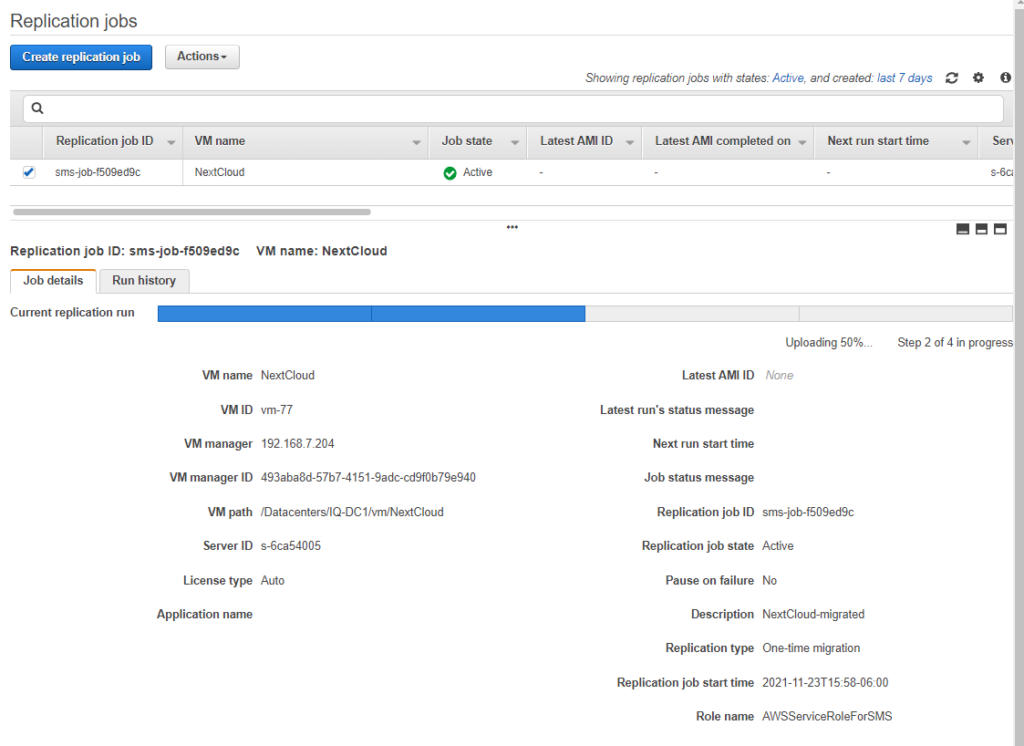
Cross referencing against the AWS Console and replication jobs shows the following.
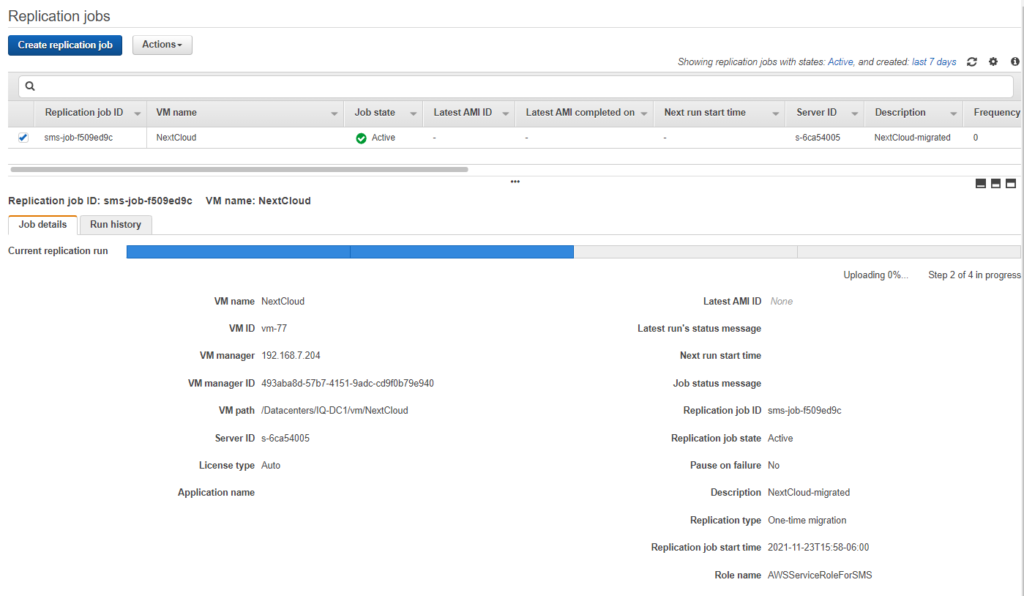
Depending on the size of the Virtual Machine and your connection to the internet, this could take awhile, but it should go provided the Kernel is supported.
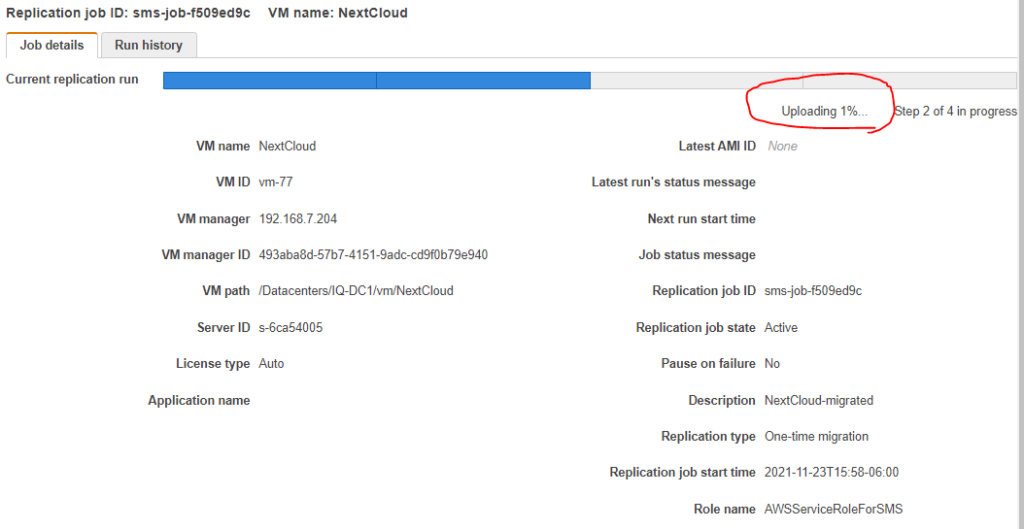
As a reminder, try to size appropriately when you perform your proof of concepts. For example, my home internet connection speed has an upload rate of 5 mbps (not Megabyte). With an 80 GB VM that is 81,920 Mb given the conversion rate of 1024. Dividing the size by the speed yields 16,384 seconds and converting from seconds to hours is 4.55 hours at the theoretical maximum speed. Just be patient and refresh your screen from time to time. Here is my progress after a couple of hours.
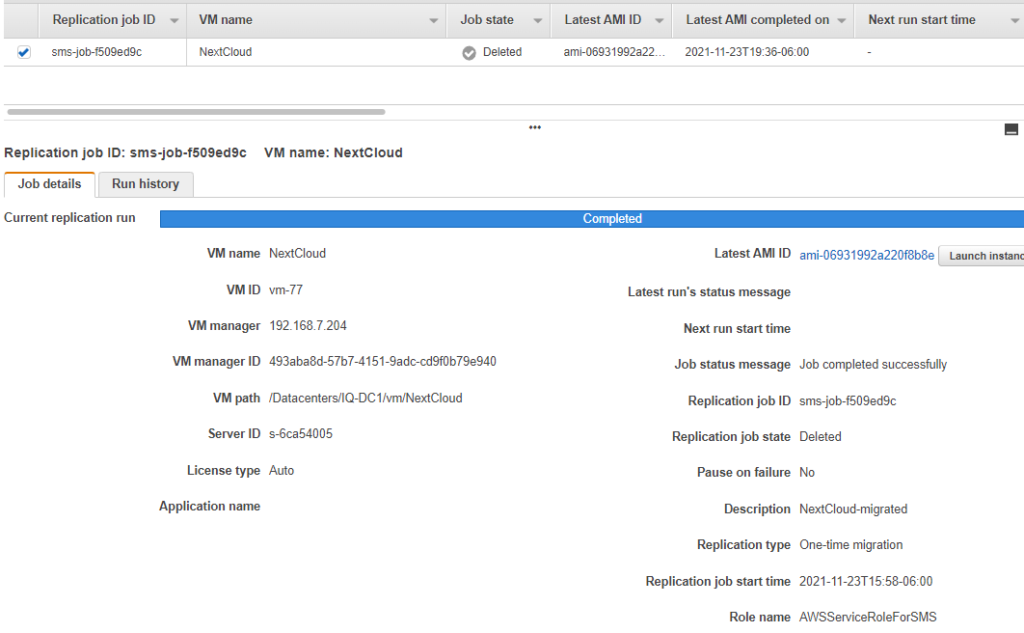
Eventually, if you check your replication jobs you will see the following. Notice the Latest AMI ID? It used to say none, but now it is a clickable link. That is the AWS template that was built off your vCenter snapshot that you can now use to deploy an instance into AWS.
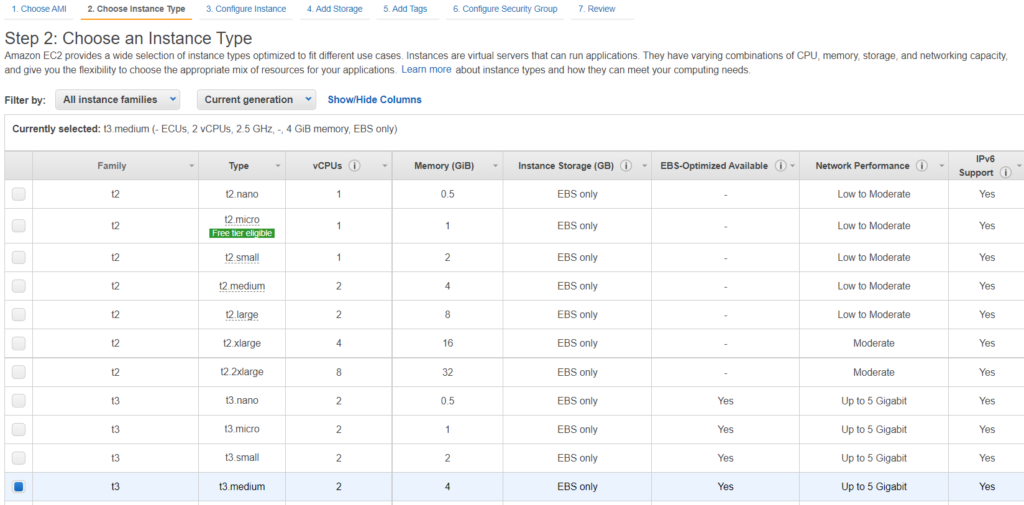
We are going to need to choose an instance type so let’s check vCenter to see our current utilization.
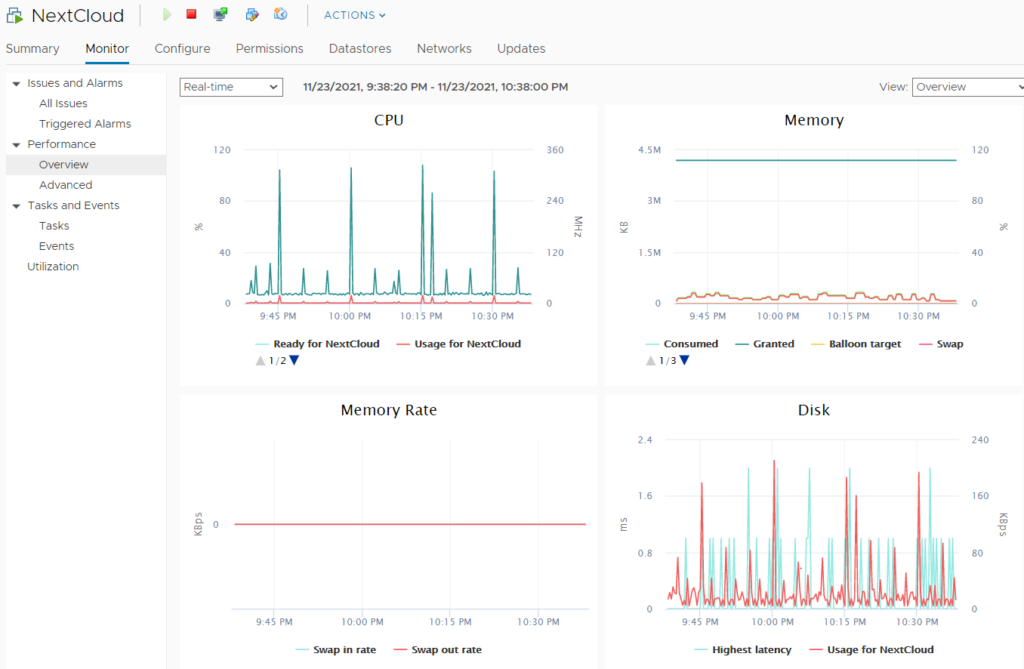
The usage is fairly low so it is probably safe to downgrade from the 2 vCPUs and 4 GB of Memory that is allocated to it. Since this is only for a temporary use, I am going to go with an On-Demand instance and will use the On-Demand Price Guide.
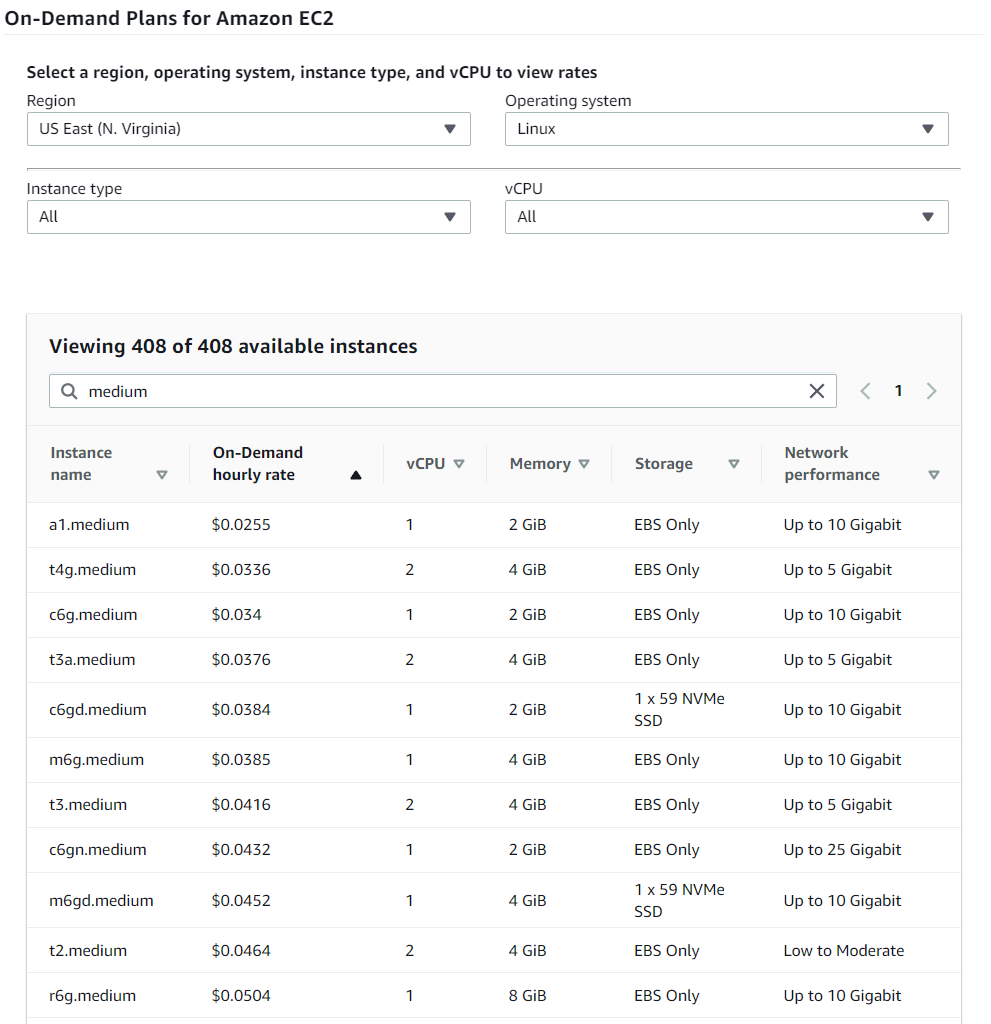
I know that I am going to go with a t4g.medium since it is the equivalent to what is being used now inside vCenter and since this is for short term I can justify paying less than 4 cents per hour. Something I wanted to point out with this chart is that the t4g.medium is cheaper than the t3.medium.
Did you know that newer hardware that is released for AWS is actually cheaper than older hardware? It is unexpected and you would tend to think older is cheaper since it is not as powerful. Why? The answer is AWS is wanting to move people away from the older generations so that they can decommission them. It makes it easier from their support perspective. The end result is that this translates to added savings.
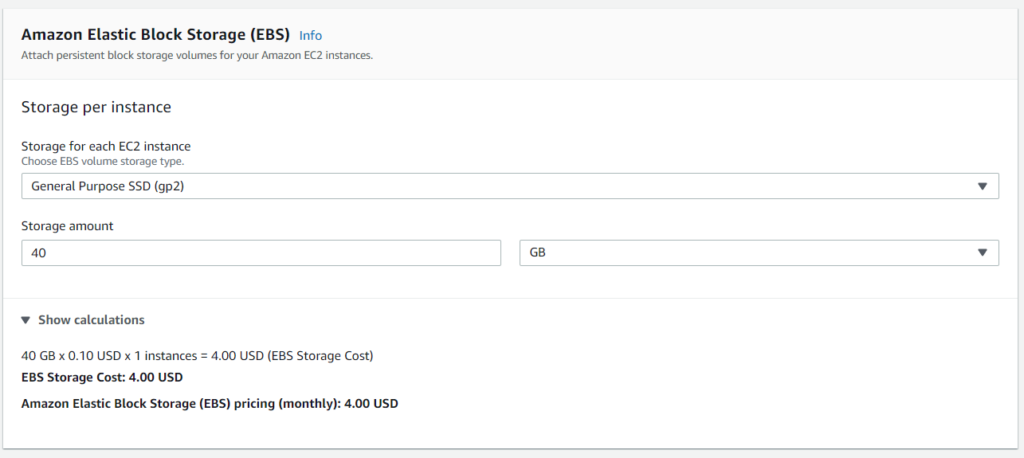
If you are wondering about the storage, you can use the EC2 calculator to determine the cost. We won’t be running it for a month, but I wanted to show what it costs for scenarios in which you forget and leave the server running longer than expected.
Now that we know what we want, go ahead and launch the instance. Choose an instance type.
Note, I went with t3.medium here since t4g.medium is not currently supported with my operating system.
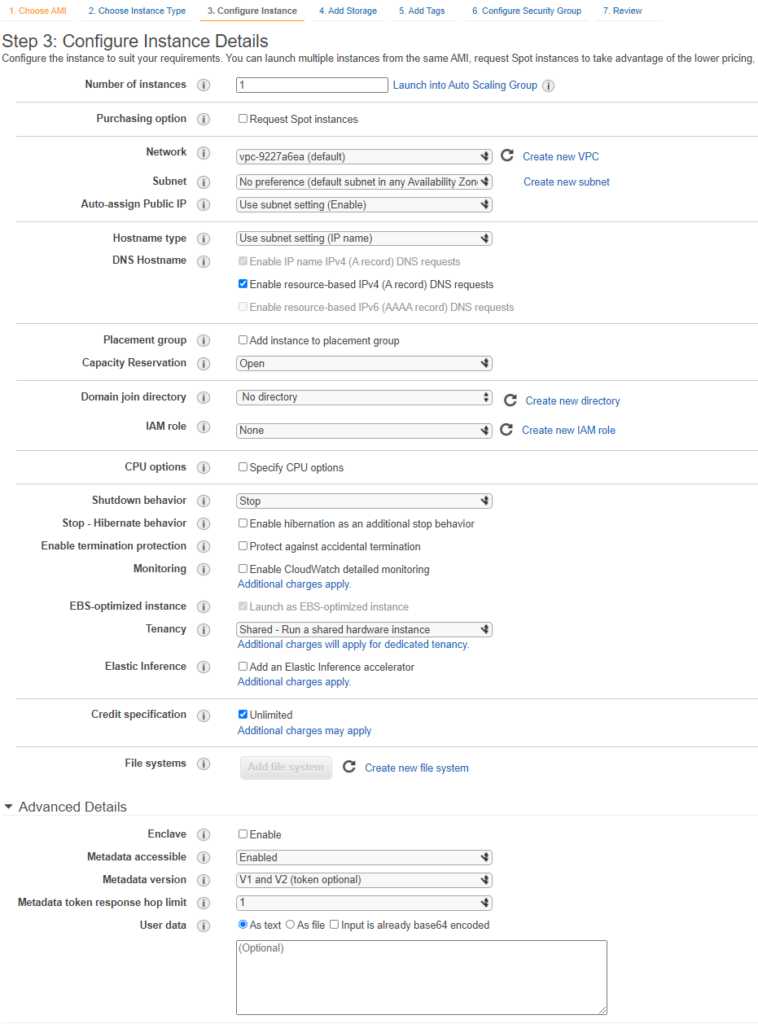
Click Configure Instance Details. A few things to note here. An autoscaling group is where you would have multiple servers that are load balanced with the load balancer configured to check certain health criteria such as processor load and then spin up additional nodes as necessary. This is ideally tied into a placement group.
CPU options allow you to dynamically customize your processor for core count and threads per core. Also, in the instance selection screen where we chose the t3.medium instance type, if we had chosen t3a.medium instead that would be using an AMD Ryzen processor as opposed to an Intel processor, hence the “a” in the name.
The user data box is where you would specify additional commands to run such as apt-get update, apt-get upgrade -y, etc.
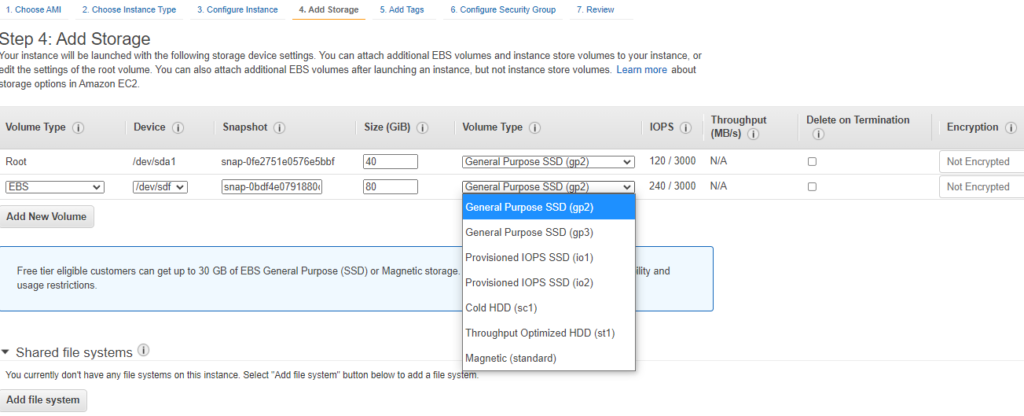
Click Add Storage. Here is where you can add additional drives. If you remember from our estimator screen a 40 GB SSD costs 4 dollars a month. Interesting tidbit, the IOPS increase as the size of the drive increases unless you choose provisioned IOPS and at that point you can specify a value you are comfortable with. This is also where you can specify encryption at rest.
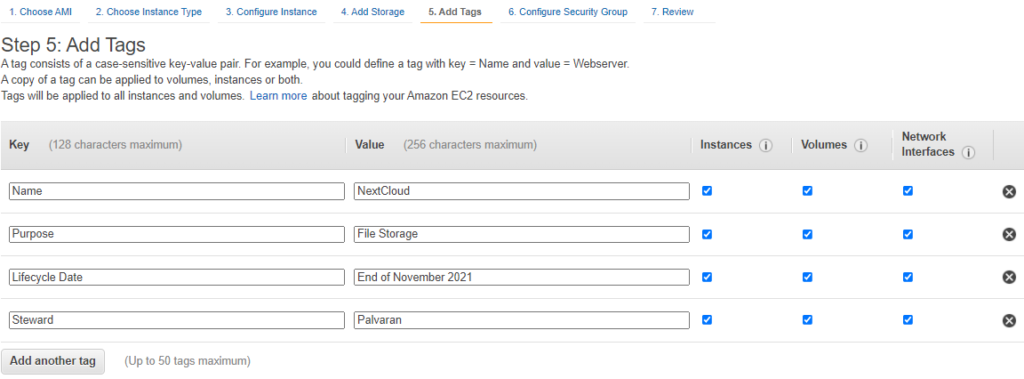
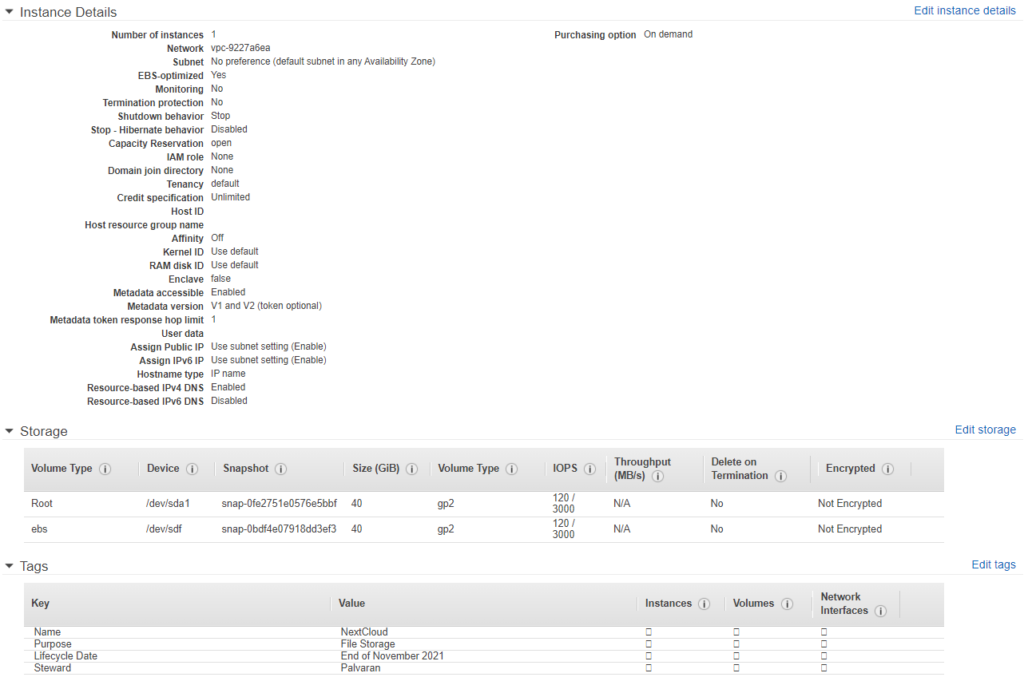
Click Add Tags and enter in your organization’s criteria.
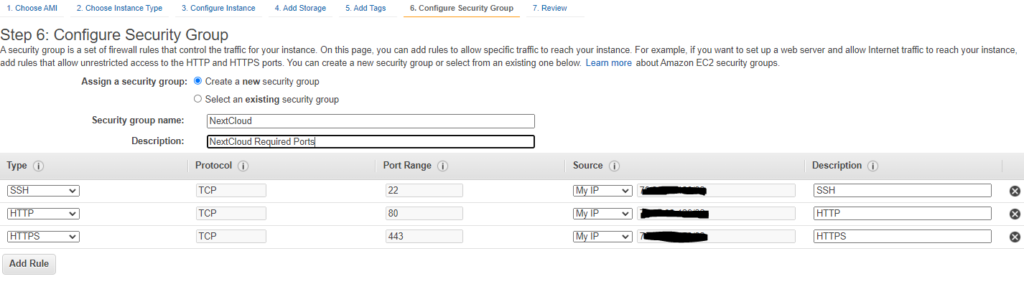
Enter in the required ports for the application. In this case, Nextcloud only needs 80 and 443, but 22 is important to perform security updates and other management functions.
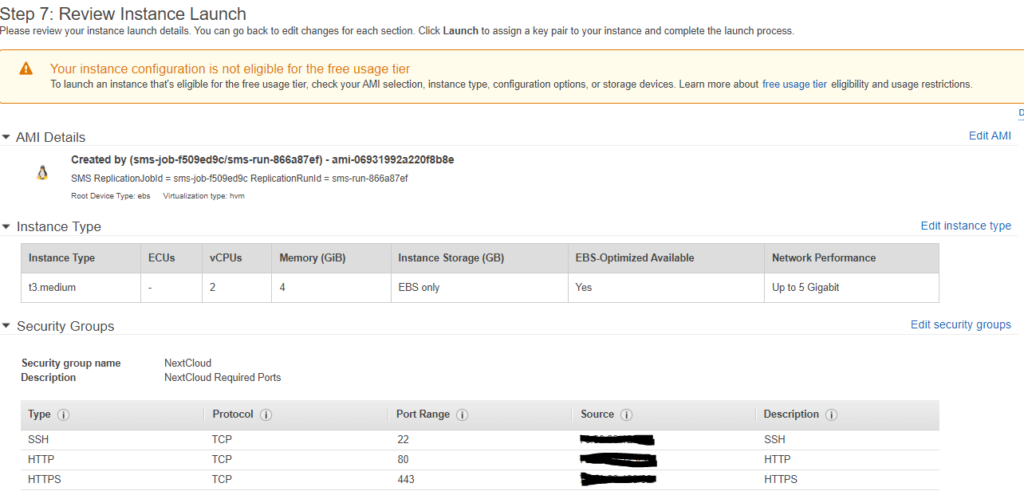
That’s it. Just hit Review and Launch.
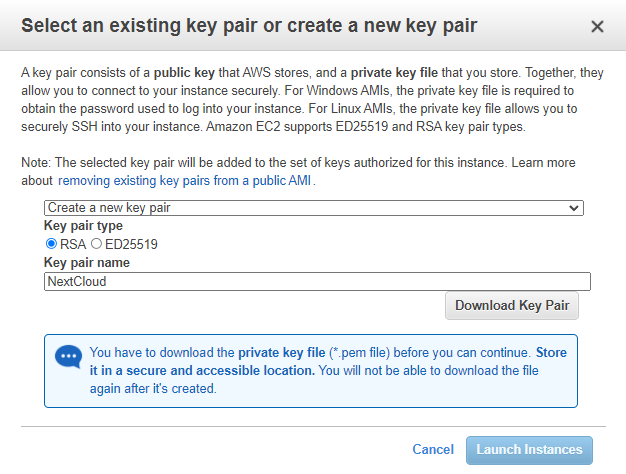
Time to hit Launch. Make sure to save the Key Pair.
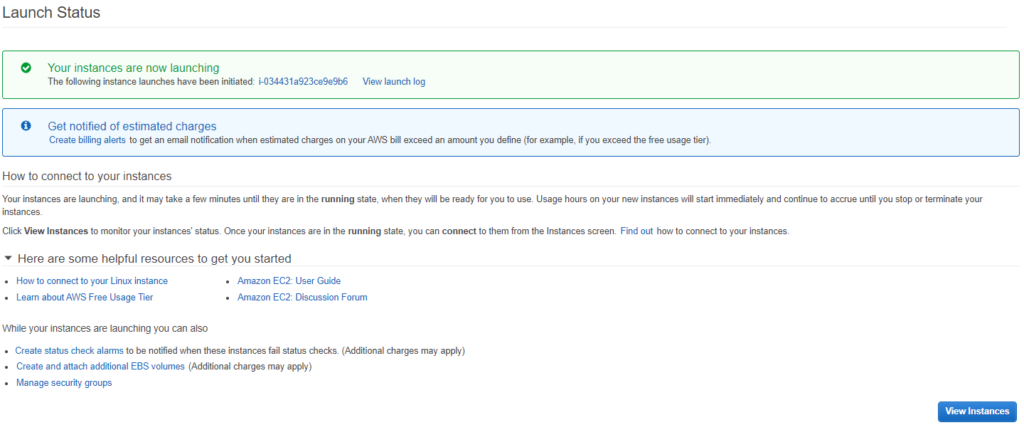
Congratulations, you did it! You just migrated your first on premise server to the cloud (AWS). Great work!
If you check instances you will see that it is initializing.
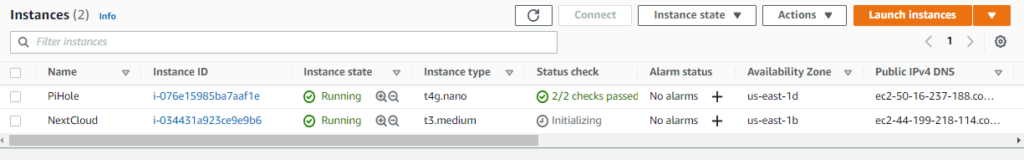
Let’s see what it gave us for an IP address.
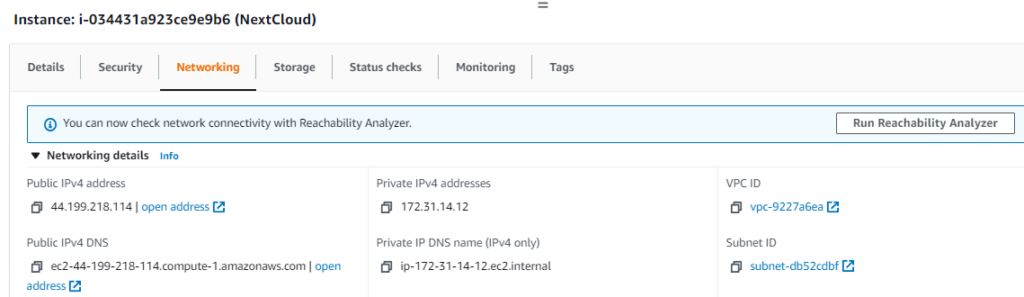
Now let’s go to the IP and see if the firewall rules are working correctly.
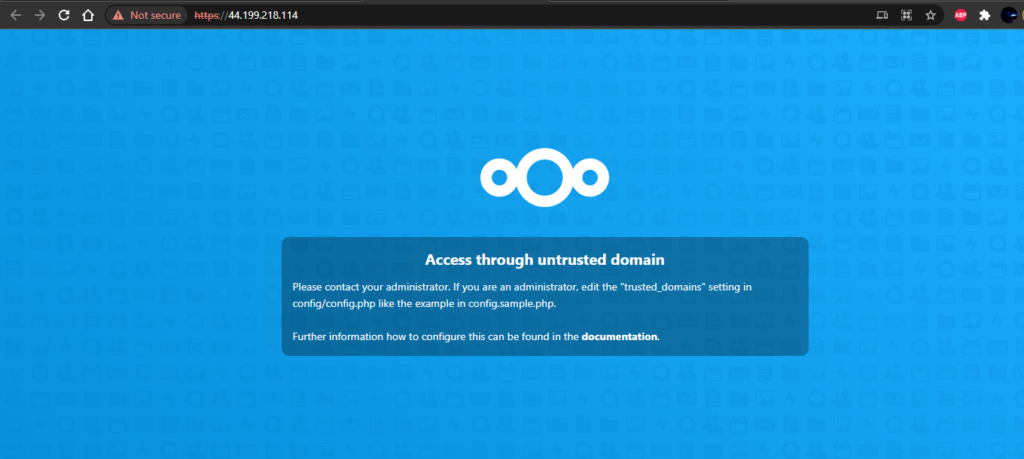
Awesome! All that is left now is that we need to update the application for some of the networking changes such as the IP address, hostname, and application configurations if we performed any, but in the end, I think you get the idea.
Summary and Closing Thoughts:
So that’s it. That is AWS, demystified. You have now seen behind the curtain at the magic and now understand the WHY, WHAT, and HOW. I hope I was able to answer some questions, spark an idea, and provide some inspiration. Now, it is time for you to be the WHO and WHERE.