
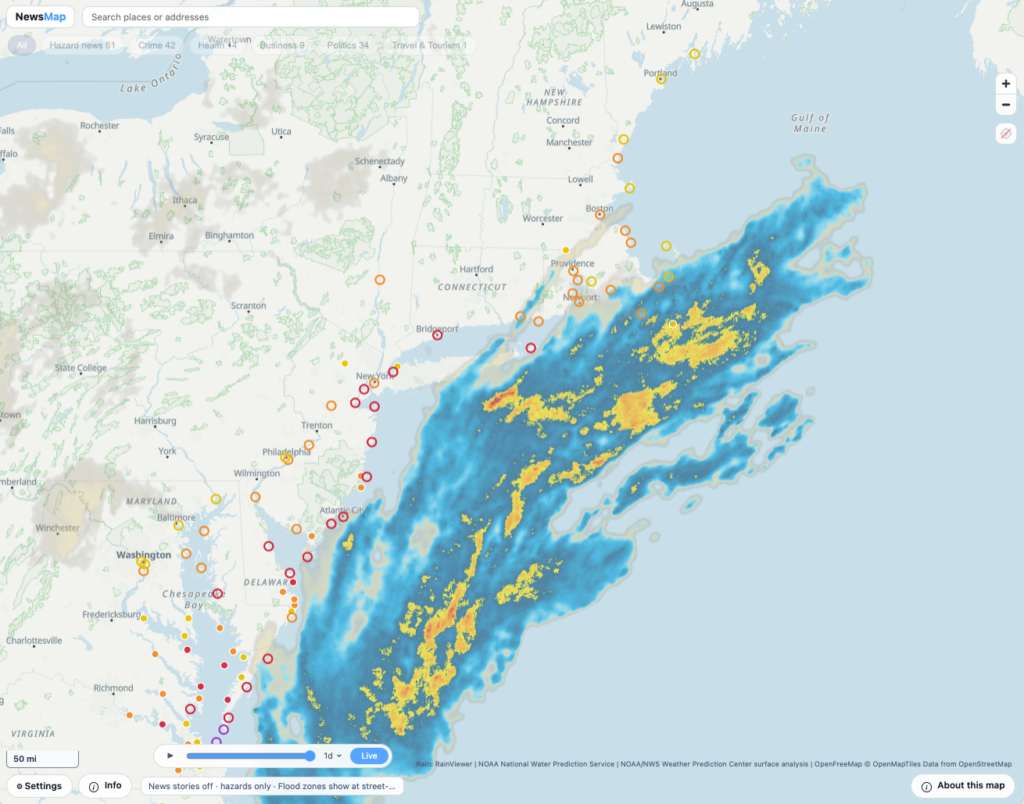
TL;DR: I built a location intelligence app that helps you understand what’s happening around you during severe weather and other emergencies. With the nor’easter happening right now, for example, you can use it to see things like river gauges, levee and bridge conditions, flood maps, weather alerts, and other information in one place.
https://newsmap.ideasquantified.com
Okay, let’s talk nor’easters. My family and I have been watching Widow’s Bay on Apple TV. It’s a supernatural comedy-horror series set in New England, and if you’ve watched it, you’ve probably heard plenty about nor’easters.
If you haven’t, a nor’easter is a powerful storm that affects the East Coast, particularly the Northeast. Depending on the storm and the temperatures, it can bring heavy rain, heavy snow, or both along with strong winds, rough seas, coastal flooding, and inland flooding.
Watching the show while a real nor’easter is affecting the region reminded me of something I’ve been building for the past several years: NewsMap.
NewsMap is a location intelligence app that brings together public data from a number of different sources and puts it on a map so you can better understand what’s happening around a location. I used the WhereTo mapping and data source engine and supercharged it with extra bits to let you see even more.
That means, during a storm like this one, instead of looking at one site for weather alerts, another for river levels, another for flooding, and another for local conditions, my goal is to bring as much of that information together as possible. I wanted to give you better information so you can make that decision yourself. I have also tried to make it as mobile friendly as I can while being as easy to use as possible.
However, this going beyond weather. Like WhereTo, it lets you look at many different layers of information outside from weather such as crime, datacenter locations, superfund locations and adds in other things like earthquakes, fires, and OpenStreetMap points of interest, and even Aurora’s for those that want to see where they are.
My favorite feature though is replay. It lets you can go back in time and watch events happen from 1 day to 30 days back. I saw a volcano alert in Chile a month ago. A volcano!

This shows the high level zoomed out with river gauges for colors to show you at a quick glance how the areas are filling up.

This is zoomed in more and lets you see the river gauges as well. This is moved closer to Boston to see how it looks the area is holding up.

This is zoomed in on the Cape Cod area and shows the FEMA mapped long term flood risk maps to give a sense of how things can look in an emergency, like with the Nor’easter.

Looking at Montauk, NY where there has been some interesting associated stories in its history and it is already at moderate flooding. Note the legend on the side to help explain things.

Zooming even more and coastal and inland flooding hitting Montauk, New York area slightly harder than other areas, but it is still moving and projected to last into the weekend.
Stay safe everyone!
If you’re in an area affected by the nor’easter or you’re just curious about what’s happening then take a look: